Concept explainers
Videos
Propose structures for compounds E and F. Compound E
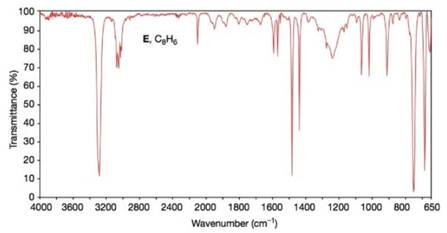
FIGURE 9.39 The IA spectrum of compound E, Problem 9.36. (? Bio-Rad Laboratories, Inc. Information Division, Sadtler Software & Databases (2012). All rights reserved. Permission for the publication herein of Sadder Spectra has been granted by Bio-Rad Laboratories, Inc. Information Division.)
Want to see the full answer?
Check out a sample textbook solution
Chapter 9 Solutions
Organic Chemistry
Additional Science Textbook Solutions
Chemistry: An Introduction to General, Organic, and Biological Chemistry (12th Edition) - Standalone book
Chemistry & Chemical Reactivity
Chemistry For Changing Times (14th Edition)
Chemistry: A Molecular Approach
The Organic Chem Lab Survival Manual: A Student's Guide to Techniques
Chemistry & Chemical Reactivity


- 3. Caffeine has a structure given by : CH3 H;C What IR peaks/bands would you expect based on the topics covered in class for this molecule (you can ignore the Nitrogen bond peaks for now) also sketch the spectra with peaks you expect.arrow_forwardPlease help Part 3A Set 2. Can IR spectroscopy be used to differentiate between the two compounds? Briefly explain why or why not. What significant absorptions would be observed in the IR spectrum?arrow_forward1. Compound M (C5H100) readily decolorizes Br2 in CCI4 and is converted to compound N (C5H120) by H2/Ni. The 'H NMR spectrum for M is shown below. The C NMR spectrum of M has signals at 146.1, 110.8, 71, and 29.4. Deduce the structures of M 13 and N. Conmoud M Chaacal Sharrow_forward
- 4. a. The ¹H NMR spectrum of a compound with the molecular formula C3H₁0O₂ is shown below (integral values are given above each set of peaks). Analysis of its ¹3C NMR spectrum shows peaks at 174, 61, 27, 14 and 9 ppm (see the posted lecture notes for June 7 for some guidance on ¹³C NMR spectroscopy). The IR spectrum shows a prominent peak at 1735 cm¹¹ and no peaks with a stretching frequency above 3000 cm³¹. What is the structure of this compound? 3.0 b. Which peak in the NMR spectrum in part a corresponds to a CH₂ group (called a "methylene") bonded to an O atom? a. 1.12 ppm b. 1.25 ppm c. 2.31 ppm e. There are no CH₂ groups bonded to an O atom in this compound. d. 4.12 ppm 1.0 PPMarrow_forward2.) Give structures for the following compounds that show two PMR sin- glets each. a. C,H,O, b. C,H10 c. CH, CI d. C,H,O, e. C,H,CI f. C,H,CI,arrow_forward2 The IR and 1H-NMR spectra of a compound with molecular formula C4H7ClO2 are shown below. Your objective as a group is to propose a structure for this compound, explaining how you reach your decision. Using all the information you have been given, in a post with others in your group share your initial ideas about the possible structure of the compound. Then use comments to interact with the other students in the group and propose a final answer to the problem. In the comment phase, you should comment on the postings of at least two other students.arrow_forward
- ( molecular formula C5H12O ) find the structure by reading spectra ...all information are enough plz explain in detailarrow_forward7. Answer all parts of this question. The synthesis of the drug minoxidil is shown below. Minoxidil is a K+ channel opener and vasodilator used in the treatment of hair loss. CI NH2 POCI3 NH3 HN NH [6] CI CI [7] CI NH2 (13) (14) [8] MCPBA NH2 NH NH2 No N. NH2 [9] CI NH2 (15) Minoxidil (a) The synthesis of compound (13) is achieved using three molar equivalents of phosphoryl chloride. This reaction [6] proceeds via a mechanism similar to that seen in the Vilsmeier reaction. Provide a complete mechanism for the substitutions of all three oxygens. What is the driving force for this reaction [6]? NN 8.arrow_forwardComplete the following answer using the data provided here: Molecular formula: C4H8O2 Important IR data (cm-1): 3280 (broad); 2980-2730 (many); 1690; 1254 All 1H NMR data (ppm, splitting, integration): 11.0 ppm (s), 1; 2.57 ppm (m), 1; 1.07 ppm (d), 6 1. Sketch out a 1H NMR spectrum showing peak locations and peak splitting on a ppm scale for the data provided above. Include the data labels above in your spectrum, but do not show integration lines. 2. draw the most proper line bond structure for the data given abovearrow_forward
- Draw the expected 1H spectra for the four compounds.arrow_forward3. The following compound forms a colorless solution in ether, but when a very strong base is added, like LDA, a red solutions forms. Show the reaction taking place and explain why the solution changes color. Lit.arrow_forward03) How to differentiate by means of Infrared spectroscopy the following isomers?arrow_forward
