Concept explainers
Videos
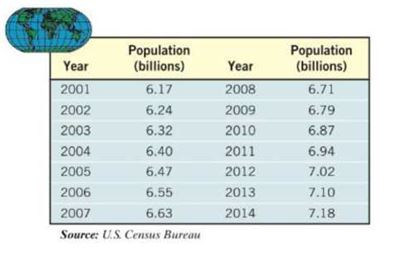
Population Model The data on the right represent the world population. An ecologist is interested in building a model that describes the world population.
(a) Using a graphing utility, draw a
(b) Using a graphing utility, build a logistic model from the data.
(c) Using a graphing utility, draw the function found in part (b) on the scatter diagram.
(d) Based on the function found in part (b), what is the carrying capacity of the world?
(e) Use the function found in part (b) to predict the population of the world in 2021.
(f) When will world population be 10 billion?
Want to see the full answer?
Check out a sample textbook solution
Chapter 5 Solutions
Precalculus Enhanced with Graphing Utilities (7th Edition)


- Does a linear, exponential, or logarithmic model best fit the data in Table 2? Find the model.arrow_forwardDoes Table 1 represent a linear function? If so, finda linear equation that models the data.arrow_forwardEnter the data from Table 2 into a graphing calculator and graph the ranking scatter plot. Determine whetherthe data from the table would likely represent a function that is linear, exponential, or logarithmic.arrow_forward
 Glencoe Algebra 1, Student Edition, 9780079039897...AlgebraISBN:9780079039897Author:CarterPublisher:McGraw Hill
 Algebra & Trigonometry with Analytic GeometryAlgebraISBN:9781133382119Author:SwokowskiPublisher:Cengage