Videos
Online Advertising Revenue The data in the table below represent the U.S. online advertising revenues for the years 2005-2014.
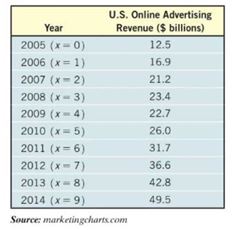
(a) Using a graphing utility, draw a
(b) Based on the scatter diagram drawn in part (a), decide what model (linear, quadratic, cubic, exponential, logarithmic, or logistic) that you think best describes the relation between year and revenue.
(c) Using a graphing utitlity, find the model of best fit.
(d) Using a graphing utility, draw the model of best fit on the scatter diagram drawn in part (a).
(e) Use your model to predict the online advertising revenue in 2016.
Want to see the full answer?
Check out a sample textbook solution
Chapter 5 Solutions
Precalculus Enhanced with Graphing Utilities (7th Edition)


- Does a linear, exponential, or logarithmic model best fit the data in Table 2? Find the model.arrow_forwardDoes Table 1 represent a linear function? If so, finda linear equation that models the data.arrow_forwardEnter the data from Table 2 into a graphing calculator and graph the ranking scatter plot. Determine whetherthe data from the table would likely represent a function that is linear, exponential, or logarithmic.arrow_forward
 Glencoe Algebra 1, Student Edition, 9780079039897...AlgebraISBN:9780079039897Author:CarterPublisher:McGraw Hill
 Algebra & Trigonometry with Analytic GeometryAlgebraISBN:9781133382119Author:SwokowskiPublisher:Cengage
 Big Ideas Math A Bridge To Success Algebra 1: Stu...AlgebraISBN:9781680331141Author:HOUGHTON MIFFLIN HARCOURTPublisher:Houghton Mifflin Harcourt