Concept explainers
Videos
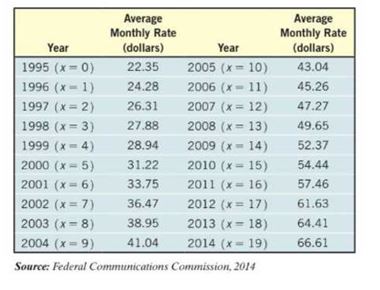
Cable Rates The data on the right represent the average monthly rate charged for expanded basic cable television in the United States from 1995 to 2014. A market researcher believes that external factors, such as the growth of satellite television and internet programming, have affected the cost of basic cable. She is interested in building a model that will describe the average monthly cost of basic cable.
(a) Using a graphing utility, draw a
(b) Using a graphing utility, build a logistic model from the data.
(c) Graph the logistic function found in part (b) on the scatter diagram.
(d) Based on the model found in part (b), what is the maximum possible average monthly rate for basic cable?
(e) Use the model to predict the average rate for basic cable in 2018.
Want to see the full answer?
Check out a sample textbook solution
Chapter 5 Solutions
Precalculus Enhanced with Graphing Utilities (7th Edition)


- Does Table 1 represent a linear function? If so, finda linear equation that models the data.arrow_forwardSales Barnes & Noble had annual sales of $6.8 billion in 2013 and $6.1 billion in 2015. Use the Midpoint Formula to estimate the sales in 2014. Assume that the annual sales followed a linear pattern.arrow_forward
 Calculus For The Life SciencesCalculusISBN:9780321964038Author:GREENWELL, Raymond N., RITCHEY, Nathan P., Lial, Margaret L.Publisher:Pearson Addison Wesley,
 Glencoe Algebra 1, Student Edition, 9780079039897...AlgebraISBN:9780079039897Author:CarterPublisher:McGraw Hill
 Trigonometry (MindTap Course List)TrigonometryISBN:9781337278461Author:Ron LarsonPublisher:Cengage Learning
 Algebra & Trigonometry with Analytic GeometryAlgebraISBN:9781133382119Author:SwokowskiPublisher:Cengage