
Introductory Statistics (10th Edition)
10th Edition
ISBN: 9780321989178
Author: Neil A. Weiss
Publisher: PEARSON
expand_more
expand_more
format_list_bulleted
Concept explainers
Videos
Textbook Question
Chapter 8, Problem 23RP
Children of Diabetic Mothers. The paper “
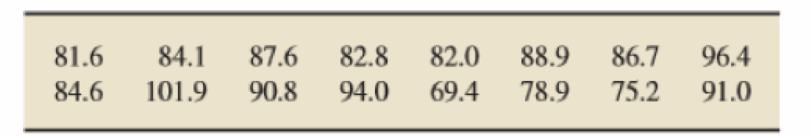
- a.Apply the t-interval procedure to these data to find a 95% confidence interval for the
mean arterial blood pressure of all children of diabetic mothers. Interpret your result in words. (Note: - b. Obtain a normal probability plot, a boxplot, a histogram, and a stem-and-leaf diagram of the data.
- c. Based on your graphs from part (b), is it reasonable to apply the t-interval procedure as you did in part (a)? Explain your answer.
Expert Solution & Answer
Want to see the full answer?
Check out a sample textbook solution
Students have asked these similar questions
Anemia (low healthy blood cells or hemoglobin) has an important role in exercise performance.
However, the direct link between rapid changes of hemoglobin and exercise performance is
still unknown. A study investigated 18 patients with a blood disorder (beta-thalassemia).
Participants in the study performed an exercise test before and the day after receiving a blood
transfusion. Data are given in the table.
HB = Hemoglobin
RER = Respiratory exchange
ID
Change in
HB
Obese
RER > 1.1
ratio
No
No
1
-1.4
No
-1.5
No
Yes
No
Yes
3
-2
No
4
-2.1
No
-1.9
Yes
Yes
No
-1.6
-1.8
-0.8
6
7
No
Yes
No
Yes
8
9.
-1
No
No
-1.2
No
Yes
10
11
No
No
-0.8
-1.5
12
Yes
No
No
Yes
13
14
-1.4
-2.6
-1.7
No
No
Yes
Yes
15
Yes
No
Yes
Yes
16
-2.6
No
17
18
-2.7
-1.5
No
The table below is from a study called “The Epidemiology of Social Stress.” The researchers in this study conduct a series of statistical tests to shed light on the association between social status variables (IVs) and depression (DVs). The left-hand column shows the tests for mean depressive symptom scores (Number of symptoms reported [range:0-50], higher levels indicate higher number of reported depressive symptoms) by sex, age, marital status, and occupational prestige. The right-hand column shows the tests for prevalence of major depressive disorder (has major depression=1; does not have major depression=0), broken down by sex, age, marital status, and occupational prestige. Examine the table and answer questions
a)At alpha=.05, what can you conclude about the association between marital status and mean depressive symptom scores? Briefly summarize the findings, and provide a plausible, logical explanation (theory) for the observed association (or lack thereof).
b)At alpha =.001,…
The data in the attached image represents blood pressure based on a new trial medication used in an experiment involving a total of 50 male and female subjects. There were two levels of treatment: 0 = placebo and 1 = treatment group. Family History Blood Pressure = Fam-Hist-BP; from the paternal side = PS; from the maternal side = MS; from both sides = BS; none on both sides or not known = N.; Blood pressure before the experiment = BP-Before-Exp; Blood pressure after the experiment = BP-After-Exp.
Task: Find the mean and standard deviation for the family history group, the before treatment group, and the after treatment group.
Chapter 8 Solutions
Introductory Statistics (10th Edition)
Ch. 8.1 - The value of a statistic used to estimate a...Ch. 8.1 - What is a confidence-interval estimate of a...Ch. 8.1 - Prob. 3ECh. 8.1 - Prob. 4ECh. 8.1 - Prob. 5ECh. 8.1 - Suppose that you lake 500 simple random samples...Ch. 8.1 - Prob. 7ECh. 8.1 - A simple random sample is taken from a population...Ch. 8.1 - Refer to Exercise 8.7 and find a point estimate...Ch. 8.1 - Prob. 10E
Ch. 8.1 - In each of Exercises 8.118.16, we provide a sample...Ch. 8.1 - Prob. 12ECh. 8.1 - In each of Exercises 8.118.16, we provide a sample...Ch. 8.1 - Prob. 14ECh. 8.1 - Prob. 15ECh. 8.1 - Prob. 16ECh. 8.1 - Wedding Costs. According to Brides Magazine,...Ch. 8.1 - Cottonmouth Litter Size. In the article The...Ch. 8.1 - Wedding Costs. Refer to Exercise 8.17. Assume that...Ch. 8.1 - Cottonmouth Litter Size. Refer to Exercise 8.18....Ch. 8.1 - Fuel Tank Capacity. Consumer Reports provides...Ch. 8.1 - Home Improvements. The American Express Retail...Ch. 8.1 - Giant Tarantulas. A tarantula has two body parts....Ch. 8.1 - Serum Cholesterol Levels. In formation on serum...Ch. 8.1 - Prob. 25ECh. 8.1 - New Mobile Homes. Refer to Examples 8.1 and 8.2....Ch. 8.2 - Find the confidence level and for a. a 90%...Ch. 8.2 - Find the confidence level and for a. an 85%...Ch. 8.2 - What is meant by saying that a 1 confidence...Ch. 8.2 - Prob. 30ECh. 8.2 - Prob. 31ECh. 8.2 - Refer to Procedure 8.1. a. Explain in detail the...Ch. 8.2 - Prob. 33ECh. 8.2 - Prob. 34ECh. 8.2 - Prob. 35ECh. 8.2 - In each of Exercises 8.348.39, assume that the...Ch. 8.2 - In each of Exercises 8.348.39, assume that the...Ch. 8.2 - In each of Exercises 8.348.39, assume that the...Ch. 8.2 - In each of Exercises 8.348.39, assume that the...Ch. 8.2 - Prob. 40ECh. 8.2 - Prob. 41ECh. 8.2 - Suppose that you will be taking a random sample...Ch. 8.2 - Prob. 43ECh. 8.2 - Prob. 44ECh. 8.2 - In each of Exercises 8.458.48, explain the effect...Ch. 8.2 - Prob. 46ECh. 8.2 - In each of Exercises 8.458.48, explain the effect...Ch. 8.2 - In each of Exercises 8.458.48, explain the effect...Ch. 8.2 - Prob. 49ECh. 8.2 - A confidence interval for a population mean has a...Ch. 8.2 - A confidence interval for a population mean has...Ch. 8.2 - Prob. 52ECh. 8.2 - Prob. 53ECh. 8.2 - In each of Exercises 8.538.60, answer true or...Ch. 8.2 - Prob. 55ECh. 8.2 - In each of Exercises 8.538.60, answer true or...Ch. 8.2 - Prob. 57ECh. 8.2 - In each of Exercises 8.538.60, answer true or...Ch. 8.2 - In each of Exercises 8.538.60, answer true or...Ch. 8.2 - In each of Exercises 8.538.60, answer true or...Ch. 8.2 - Formula 8.2 on page 344 provides a method for...Ch. 8.2 - Prob. 62ECh. 8.2 - Prob. 63ECh. 8.2 - In each of Exercises 8.638.68, we provide a sample...Ch. 8.2 - Prob. 65ECh. 8.2 - In each of Exercises 8.638.68, we provide a sample...Ch. 8.2 - In each of Exercises 8.638.68, we provide a sample...Ch. 8.2 - In each of Exercises 8.638.68, we provide a sample...Ch. 8.2 - Preliminary data analyses indicate that you can...Ch. 8.2 - Preliminary data analyses indicate that you can...Ch. 8.2 - Preliminary data analyses indicate that you can...Ch. 8.2 - Preliminary data analyses indicate that you can...Ch. 8.2 - Preliminary data analyses indicate that you can...Ch. 8.2 - Preliminary data analyses indicate that you can...Ch. 8.2 - Prob. 75ECh. 8.2 - Prob. 76ECh. 8.2 - Medical Marijuana. An issue with legalization of...Ch. 8.2 - Prob. 78ECh. 8.2 - Medical Marijuana. Refer to Exercise 8.77. a....Ch. 8.2 - American Alligators. Refer to Exercise 8.78. a....Ch. 8.2 - Medical Marijuana. Refer to Exercise 8.77. a. The...Ch. 8.2 - Prob. 82ECh. 8.2 - Prob. 83ECh. 8.2 - Prob. 84ECh. 8.2 - Pulmonary Hypertension. In the paper Persistent...Ch. 8.2 - Fuel Expenditures. In estimating the mean monthly...Ch. 8.2 - Prob. 87ECh. 8.2 - Prob. 88ECh. 8.2 - Political Prisoners. In Exercise 8.73, you found a...Ch. 8.2 - Keep on Rolling. In Exercise 8.74, you found a 99%...Ch. 8.2 - Prob. 91ECh. 8.2 - Prob. 92ECh. 8.2 - Doing Time. The U.S. Department of Justice, Office...Ch. 8.2 - Doing Time. The U.S. Department of Justice, Office...Ch. 8.2 - Prob. 95ECh. 8.2 - Prob. 96ECh. 8.2 - Prob. 97ECh. 8.2 - Corporate Farms. The U.S. Census Bureau estimates...Ch. 8.2 - Body Temperature. A study by researchers at the...Ch. 8.2 - Prob. 100ECh. 8.2 - Clocking the Cheetah. The cheetah (Acinonyx...Ch. 8.2 - Prob. 103ECh. 8.2 - Prob. 104ECh. 8.2 - Prob. 105ECh. 8.2 - Prob. 106ECh. 8.2 - Toxic Mushrooms? Refer to Exercise 8.71. a....Ch. 8.3 - Why do you need to consider the studentized...Ch. 8.3 - Prob. 109ECh. 8.3 - Prob. 110ECh. 8.3 - Prob. 111ECh. 8.3 - Batting Averages. An issue of Scientific American...Ch. 8.3 - Prob. 113ECh. 8.3 - Two t-curves have degrees of freedom 12 and 20,...Ch. 8.3 - For a t-curve with df = 6, use Table IV to find...Ch. 8.3 - For a t-curve with df = 17, use Table IV to find...Ch. 8.3 - Prob. 117ECh. 8.3 - Prob. 118ECh. 8.3 - Fuel Tank Capacity. Consumer Reports provides...Ch. 8.3 - Prob. 120ECh. 8.3 - Prob. 121ECh. 8.3 - Prob. 122ECh. 8.3 - In each of Exercises 8.1238.128, we provide a...Ch. 8.3 - In each of Exercises 8.1238.128, we provide a...Ch. 8.3 - In each of Exercises 8.1238.128, we provide a...Ch. 8.3 - Prob. 126ECh. 8.3 - Prob. 127ECh. 8.3 - In each of Exercises 8.1238.128, we provide a...Ch. 8.3 - Preliminary data analyses indicate that you can...Ch. 8.3 - Preliminary data analyses indicate that you can...Ch. 8.3 - Sleep. In 1908, W. S. Gosset published the article...Ch. 8.3 - Preliminary data analyses indicate that you can...Ch. 8.3 - Preliminary data analyses indicate that you can...Ch. 8.3 - Preliminary data analyses indicate that you can...Ch. 8.3 - In each of Exercises 8.135-8.138, use the...Ch. 8.3 - Prob. 136ECh. 8.3 - In each of Exercises 8.1358.138, use the...Ch. 8.3 - Prob. 138ECh. 8.3 - The Coruros Burrow. The subterranean coruro...Ch. 8.3 - Forearm Length. In 1903. K Pearson and A. Lee...Ch. 8.3 - Blood Cholesterol and Heart Disease. Numerous...Ch. 8.3 - Bicycle Commuting Times. A city planner working on...Ch. 8.3 - Prob. 143ECh. 8.3 - Prob. 144ECh. 8.3 - Prob. 146ECh. 8.3 - Another type of confidence interval is called a...Ch. 8.3 - Another type of confidence interval is called a...Ch. 8.3 - Prob. 149ECh. 8.3 - Christmas Spending. In a national poll of 1039...Ch. 8 - Explain the difference between a point estimate of...Ch. 8 - Answer true or false to the following statement,...Ch. 8 - Must the variable under consideration be normally...Ch. 8 - Prob. 4RPCh. 8 - Prob. 5RPCh. 8 - Suppose that you intend to find a 95% confidence...Ch. 8 - A confidence interval for a population mean has a...Ch. 8 - Suppose that you plan to apply the one-mean...Ch. 8 - A variable of a population has a mean of 266 and a...Ch. 8 - Baby Weight. The paper Are Babies Normal? by T....Ch. 8 - The following figure shows the standard normal...Ch. 8 - In each of Problems 1217, we have provided a...Ch. 8 - In each of Problems 1217, we have provided a...Ch. 8 - In each of Problems 1217, we have provided a...Ch. 8 - In each of Problems 1217, we have provided a...Ch. 8 - In each of Problems 1217, we have provided a...Ch. 8 - In each of Problems 1217, we have provided a...Ch. 8 - For a t-curve with df = 18, obtain the t-value and...Ch. 8 - Millionaires. Dr. Thomas Stanley of Georgia Slate...Ch. 8 - Millionaires. From Problem 19, we know that a 95%...Ch. 8 - Prison Sentences. Researchers M. Dhami et al....Ch. 8 - Prison Sentences. Refer to Problem 21. a. Find the...Ch. 8 - Children of Diabetic Mothers. The paper...Ch. 8 - Diamond Pricing. In a Singapore edition of...Ch. 8 - Wildfires. Wildfires are uncontrolled fires that...Ch. 8 - Fuel Economy. The U.S. Department of Energy...Ch. 8 - Prob. 28RPCh. 8 - UWEC UNDERGRADUATES Recall from Chapter 1 (see...Ch. 8 - BANK ROBBERIES: A STATISTICAL ANALYSIS At the...
Knowledge Booster


Learn more about
Need a deep-dive on the concept behind this application? Look no further. Learn more about this topic, statistics and related others by exploring similar questions and additional content below.Similar questions
- The data in the attached image represents blood pressure based on a new trial medication used in an experiment involving a total of 50 male and female subjects. There were two levels of treatment: 0 = placebo and 1 = treatment group. Family History Blood Pressure = Fam-Hist-BP; from the paternal side = PS; from the maternal side = MS; from both sides = BS; none on both sides or not known = N.; Blood pressure before the experiment = BP-Before-Exp; Blood pressure after the experiment = BP-After-Exp. Task: Construct a side-by-side boxplot to compare the variables BP-Before-Exp and BP-After-Exp.arrow_forwardThe data in the attached image represents blood pressure based on a new trial medication used in an experiment involving a total of 50 male and female subjects. There were two levels of treatment: 0 = placebo and 1 = treatment group. Family History Blood Pressure = Fam-Hist-BP; from the paternal side = PS; from the maternal side = MS; from both sides = BS; none on both sides or not known = N.; Blood pressure before the experiment = BP-Before-Exp; Blood pressure after the experiment = BP-After-Exp. Task: Construct a scatterplot to display the relationship and find the correlation between age and BP-Before Exp.arrow_forwardThe data in the attached image represents blood pressure based on a new trial medication used in an experiment involving a total of 50 male and female subjects. There were two levels of treatment: 0 = placebo and 1 = treatment group. Family History Blood Pressure = Fam-Hist-BP; from the paternal side = PS; from the maternal side = MS; from both sides = BS; none on both sides or not known = N.; Blood pressure before the experiment = BP-Before-Exp; Blood pressure after the experiment = BP-After-Exp. Task: Construct a histogram to represent the family BP history, the subjects' BP before treatment and the subjects' BP after treatment.arrow_forward
- The data in the attached image represents blood pressure based on a new trial medication used in an experiment involving a total of 50 male and female subjects. There were two levels of treatment: 0 = placebo and 1 = treatment group. Family History Blood Pressure = Fam-Hist-BP; from the paternal side = PS; from the maternal side = MS; from both sides = BS; none on both sides or not known = N.; Blood pressure before the experiment = BP-Before-Exp; Blood pressure after the experiment = BP-After-Exp. Task: Construct a scatterplot to display the relationship and find the correlation between BP-Before-Exp and BP-After-Exp.arrow_forwardNCI Cancer Bulletin, December 2, 2008 Volume 5 / Number 24 Title of the article: After Menopause, Weight Affects Breast Cancer Rates More than Mammography Use Women who are overweight or obese after menopause face an increased risk of breast cancer, but a large prospective cohort study indicates that the frequency of mammography use and screening accuracy are not the primary explanations for higher rates of breast cancer in these women. The same is true of large, invasive breast cancer tumors and advanced stage disease; risk increases with weight, but higher rates are not explained by the frequency or accuracy of screening mammography before breast cancer was diagnosed. The study appears in the December 3 Journal of the National Cancer Institute. Dr. Karla Kerlikowske of the San Francisco Veterans Affairs Medical Center and colleagues gathered data on 287,115 postmenopausal women who were registered in the Breast Cancer Surveillance Consortium database. Reflecting a trend in the…arrow_forwardNCI Cancer Bulletin, December 2, 2008 Volume 5 / Number 24 Title of the article: After Menopause, Weight Affects Breast Cancer Rates More than Mammography Use Women who are overweight or obese after menopause face an increased risk of breast cancer, but a large prospective cohort study indicates that the frequency of mammography use and screening accuracy are not the primary explanations for higher rates of breast cancer in these women. The same is true of large, invasive breast cancer tumors and advanced stage disease; risk increases with weight, but higher rates are not explained by the frequency or accuracy of screening mammography before breast cancer was diagnosed. The study appears in the December 3 Journal of the National Cancer Institute. Dr. Karla Kerlikowske of the San Francisco Veterans Affairs Medical Center and colleagues gathered data on 287,115 postmenopausal women who were registered in the Breast Cancer Surveillance Consortium database. Reflecting a trend in the…arrow_forward
- NCI Cancer Bulletin, December 2, 2008 Volume 5 / Number 24 Title of the article: After Menopause, Weight Affects Breast Cancer Rates More than Mammography Use Women who are overweight or obese after menopause face an increased risk of breast cancer, but a large prospective cohort study indicates that the frequency of mammography use and screening accuracy are not the primary explanations for higher rates of breast cancer in these women. The same is true of large, invasive breast cancer tumors and advanced stage disease; risk increases with weight, but higher rates are not explained by the frequency or accuracy of screening mammography before breast cancer was diagnosed. The study appears in the December 3 Journal of the National Cancer Institute. Dr. Karla Kerlikowske of the San Francisco Veterans Affairs Medical Center and colleagues gathered data on 287,115 postmenopausal women who were registered in the Breast Cancer Surveillance Consortium database. Reflecting a trend in the…arrow_forwardNCI Cancer Bulletin, December 2, 2008 Volume 5 / Number 24 Title of the article: After Menopause, Weight Affects Breast Cancer Rates More than Mammography Use Women who are overweight or obese after menopause face an increased risk of breast cancer, but a large prospective cohort study indicates that the frequency of mammography use and screening accuracy are not the primary explanations for higher rates of breast cancer in these women. The same is true of large, invasive breast cancer tumors and advanced stage disease; risk increases with weight, but higher rates are not explained by the frequency or accuracy of screening mammography before breast cancer was diagnosed. The study appears in the December 3 Journal of the National Cancer Institute. Dr. Karla Kerlikowske of the San Francisco Veterans Affairs Medical Center and colleagues gathered data on 287,115 postmenopausal women who were registered in the Breast Cancer Surveillance Consortium database. Reflecting a trend in the…arrow_forwardAnalysis of a set of data for 193 countries reported in the cross-country analysis by Bulled and Sosis (2010) revealed that the correlation between the adult literacy rate in a country and the life expectancy inthe country was r = 0.70. (a) What is the adjusted r2 for predicting life expectancy from the literacy rate?(b) Explain what this adjusted r2 means for this set of data. (c) What, if any, is the causal relationsuggested by this correlation and adjusted r2? Speculate on the nature of the causal relation underlying the correlation.arrow_forward
- Elissa Epel, a professor of health psychology at the University of California–San Francisco, studied women in high- and low-stress situations. She found that women with higher cortisol responses to stress ate significantly more sweet food and consumed more calories on the stress day compared with those with low cortisol responses, and compared with themselves on lower stress days. Increases in negative mood in response to the stressors were also significantly related to greater food consumption. These results suggest that psychophysiological responses to stress may influence subsequent eating behavior. Over time, these alterations could impact both weight and health. You are interested in studying whether students living in the dorms or students living off campus have higher cortisol levels. You ask a sample of n₁ = 25 students living in the dorms and n₂ = 30 students living off campus to record their afternoon cortisol levels for a week. The average cortisol level for students living…arrow_forwardElissa Epel, a professor of health psychology at the University of California-San Francisco, studied women in high- and low-stress situations. She found that women with higher cortisol responses to stress ate significantly more sweet food and consumed more calories on the stress day compared with those with low cortisol responses, and compared with themselves on lower stress days. Increases in negative mood in response to the stressors were also significantly related to greater food consumption. These results suggest that psychophysiological responses to stress may influence subsequent eating behavior. Over time, these alterations could impact both weight and health. You are interested in studying whether college juniors or college sophomores consume more calories. You ask a sample of n, = 35 college juniors and n2 = 40 college sophomores to record their daily caloric intake for a week. The average daily caloric intake for college juniors was M1 2,423 calories, with a standard…arrow_forwardFoot ulcers are a common problem for people with diabetes. Higher skin temperatures on the foot indicate an increased risk of ulcers. The article "An Intelligent Insole for Diabetic Patients with the Loss of Protective Sensation" (Kimberly Anderson, M.S. Thesis, Colorado School of Mines), reports measurements of temperatures, in °F, of both feet for 181 diabetic patients. The results are presented in the following table. Left Foot Right Foot 80 80 85 85 75 80 88 86 89 87 87 82 78 78 88 89 89 90 76 81 89 86 87 82 78 78 80 81 87 82 86 85 76 80 88 89 Construct a scatterplot of the right foot temperature (y) versus the left foot temperature (x). Verify that a linear model is appropriate. b. Compute the least-squares line for predicting the right foot temperature from the left foot temperature. If the left foot temperatures of two patients differ by 2 degrees, by how much would you predict their right foot temperatures to differ? Predict the right foot temperature for a patient whose left…arrow_forward
arrow_back_ios
SEE MORE QUESTIONS
arrow_forward_ios
Recommended textbooks for you
 Calculus For The Life SciencesCalculusISBN:9780321964038Author:GREENWELL, Raymond N., RITCHEY, Nathan P., Lial, Margaret L.Publisher:Pearson Addison Wesley,
 Glencoe Algebra 1, Student Edition, 9780079039897...AlgebraISBN:9780079039897Author:CarterPublisher:McGraw Hill
 Big Ideas Math A Bridge To Success Algebra 1: Stu...AlgebraISBN:9781680331141Author:HOUGHTON MIFFLIN HARCOURTPublisher:Houghton Mifflin Harcourt
Calculus For The Life Sciences
Calculus
ISBN:9780321964038
Author:GREENWELL, Raymond N., RITCHEY, Nathan P., Lial, Margaret L.
Publisher:Pearson Addison Wesley,
Glencoe Algebra 1, Student Edition, 9780079039897...
Algebra
ISBN:9780079039897
Author:Carter
Publisher:McGraw Hill
Big Ideas Math A Bridge To Success Algebra 1: Stu...
Algebra
ISBN:9781680331141
Author:HOUGHTON MIFFLIN HARCOURT
Publisher:Houghton Mifflin Harcourt
Correlation Vs Regression: Difference Between them with definition & Comparison Chart; Author: Key Differences;https://www.youtube.com/watch?v=Ou2QGSJVd0U;License: Standard YouTube License, CC-BY
Correlation and Regression: Concepts with Illustrative examples; Author: LEARN & APPLY : Lean and Six Sigma;https://www.youtube.com/watch?v=xTpHD5WLuoA;License: Standard YouTube License, CC-BY