
Concept explainers
Videos
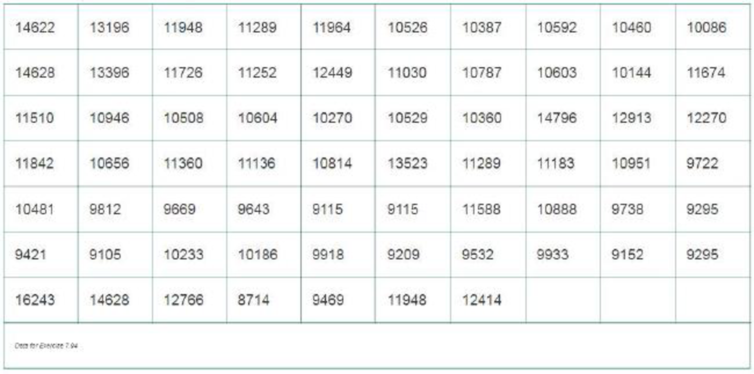
Cooling method for gas turbines. During periods of high electricity demand, especially during the hot summer months, the power output from a gas turbine engine can drop dramatically. One way to counter this drop in power is by cooling the inlet air to the gas turbine. An increasingly popular cooling method uses high-pressure inlet fogging. The performance of a sample of 67 gas turbines augmented with high-pressure inlet fogging was investigated in the Journal of Engineering for Gas Turbines and Power (January 2005). One measure of performance is heat rate (kilojoules per kilowatt per hour). Heat rates for the 67 gas turbines are listed in the table below. Suppose that standard gas turbines have heat rates with a standard deviation of 1,500 kJ/kWh. Is there sufficient evidence to indicate that the heat rates of the augmented gas turbine engine are more variable than the heat rates of the standard gas turbine engine? Test using α = .05.
Want to see the full answer?
Check out a sample textbook solution
Chapter 7 Solutions
Statistics for Business and Economics (13th Edition)


- Inorganic phosphorous is a naturally occurring element in all plants and animals, with concentrations increasing progressively up the food chain (fruit < vegetables < cereals < nuts < corpse). Geochemical surveys take soil samples to determine phosphorous content (in ppm, parts per million). A high phosphorous content may or may not indicate an ancient burial site, food storage site, or even a garbage dump. Independent random samples from two regions gave the following phosphorous measurements (in ppm). Assume the distribution of phosphorous is mound-shaped and symmetric for these two regions Region I: x1; n1 = 15 855 1550 1230 875 1080 2330 1850 1860 2340 1080 910 1130 1450 1260 1010 Region II: x2; n2 = 14 540 810 790 1230 1770 960 1650 860 890 640 1180 1160 1050 1020 (a) Use a calculator with mean and standard deviation keys to verify that x1, s1, x2, and s2. (Round your answers to one decimal place.) x1 = ppm s1 = ppm x2 = ppm s2 = ppm…arrow_forwardInorganic phosphorous is a naturally occurring element in all plants and animals, with concentrations increasing progressively up the food chain (fruit < vegetables < cereals < nuts < corpse). Geochemical surveys take soil samples to determine phosphorous content (in ppm, parts per million). A high phosphorous content may or may not indicate an ancient burial site, food storage site, or even a garbage dump. Independent random samples from two regions gave the following phosphorous measurements (in ppm). Assume the distribution of phosphorous is mound-shaped and symmetric for these two regions. Region 1: x1;n1=15 857 1,551 1,230 875 1,080 2,330 1,850 1,860 2,340 1,080 910 1,130 1,450 1,260 1,010 region 11: x2;n2-14 538 812 790 1,230 1,770 960 1,650 860 890 640 1,180 1,160 1,050 1,020 (a)Use a calculator with mean and standard deviation keys to verify that x1, s1, x2, and s2. (Round your answers to four decimal places.) x1= ppm s1= ppm x2= ppm s2= ppm…arrow_forwardInorganic phosphorous is a naturally occurring element in all plants and animals, with concentrations increasing progressively up the food chain (fruit < vegetables < cereals < nuts < corpse). Geochemical surveys take soil samples to determine phosphorous content (in ppm, parts per million). A high phosphorous content may or may not indicate an ancient burial site, food storage site, or even a garbage dump. Independent random samples from two regions gave the following phosphorous measurements (in ppm). Assume the distribution of phosphorous is mound-shaped and symmetric for these two regions. REGION I:X1;N1=15 857 1,551 1,230 875 1,080 2,330 1,850 1,860 2,340 1,080 910 1,130 1,450 1,260 1,010 REGION II:X2;N2=14 538 812 790 1,230 1,770 960 1,650 860 890 640 1,180 1,160 1,050 1,020 (a) Use a calculator with mean and standard deviation keys to verify that x1, s1, x2, and s2. (Round your answers to four decimal places.) x1= ppm s1= ppm x2= ppm s2= ppm…arrow_forward
- Inorganic phosphorous is a naturally occurring element in all plants and animals, with concentrations increasing progressively up the food chain (fruit < vegetables < cereals < nuts < corpse). Geochemical surveys take soil samples to determine phosphorous content (in ppm, parts per million). A high phosphorous content may or may not indicate an ancient burial site, food storage site, or even a garbage dump. Independent random samples from two regions gave the following phosphorous measurements (in ppm). Assume the distribution of phosphorous is mound-shaped and symmetric for these two regions Region I: x1; n1 = 15 855 1550 1230 875 1080 2330 1850 1860 2340 1080 910 1130 1450 1260 1010 Region II: x2; n2 = 14 540 810 790 1230 1770 960 1650 860 890 640 1180 1160 1050 1020 (a) Use a calculator with mean and standard deviation keys to verify that x1, S1, X2, and s2. (Round your answers to one decimal place.) X1 ppm S1 = ppm X2 = ppm S2 = ppm (b) Let µ1 be the population mean for x1 and let…arrow_forwardInorganic phosphorous is a naturally occurring element in all plants and animals, with concentrations increasing progressively up the food chain (fruit < vegetables < cereals < nuts < corpse). Geochemical surveys take soil samples to determine phosphorous content (in ppm, parts per million). A high phosphorous content may or may not indicate an ancient burial site, food storage site, or even a garbage dump. Independent random samples from two regions gave the following phosphorous measurements (in ppm). Assume the distribution of phosphorous is mound-shaped and symmetric for these two regions. Region I: x1; n1 = 15 857 1,551 1,230 875 1,080 2,330 1,850 1,860 2,340 1,080 910 1,130 1,450 1,260 1,010 Region II: x2; n2 = 14 538 808 790 1,230 1,770 960 1,650 860 890 640 1,180 1,160 1,050 1,020 (a) Use a calculator with mean and standard deviation keys to verify that x1, s1, x2, and s2. (Round your answers to four decimal places.) x1= 1387.5333 ppm s1=…arrow_forwardDDT (dichlorodiphenyltrichloroethane) was used extensively from 1940 to 1970 as an insecticide. It still sees limited use for control of disease. But DDT was found to be harmful to plants and animals, including humans, and its effects were found to be lasting. The amount of time that DDT remains in the environment depends on many factors, but the following table shows what can be expected of 200 kilograms of DDT that has seeped into the soil. t = time in yearssince application D = DDT remaining,kilograms 0 200.00 1 190.00 2 180.50 3 171.48 (a) Show that the data are exponential. The ratio from year 0 to year 1 is ______ , from year 1 to year 2 is ____ , and from year 2 to year 3 is_____ (rounded to two decimal places). Because these successive ratios are all , a) different b)the same , the data are exponential.arrow_forward
- Inorganic phosphorous is a naturally occurring element in all plants and animals, with concentrations increasing progressively up the food chain (fruit < vegetables < cereals < nuts < corpse). Geochemical surveys take soil samples to determine phosphorous content (in ppm, parts per million). A high phosphorous content may or may not indicate an ancient burial site, food storage site, or even a garbage dump. Independent random samples from two regions gave the following phosphorous measurements (in ppm). Assume the distribution of phosphorous is mound-shaped and symmetric for these two regions. Region I: x1; n1 = 15 853 1,549 1,230 875 1,080 2,330 1,850 1,860 2,340 1,080 910 1,130 1,450 1,260 1,010 Region II: x2; n2 = 14 538 808 790 1,230 1,770 960 1,650 860 890 640 1,180 1,160 1,050 1,020 (a) Use a calculator with mean and standard deviation keys to verify that x1, s1, x2, and s2. (Round your answers to four decimal places.) x1= ppm s1= ppm x2= ppm s2=…arrow_forwardPlease use the accompanying Excel data set or accompanying Text file data set when completing the following exercise. An article in Urban Ecosystems, "Urbanization and Warming of Phoenix (Arizona, USA): Impacts, Feedbacks and Mitigation" (2002, Vol. 6, pp. 183–203), mentions that Phoenix is ideal to study the effects of an urban heat island because it has grown from a population of 300,000 to approximately 3 million over the last 50 years and this is a period with a continuous, detailed climate record. The 50-year averages of the mean annual temperatures at eight sites in Phoenix are shown below. Check the assumption of normality in the population with a probability plot. Construct a 95% confidence interval for the standard deviation over the sites of the mean annual temperatures. Site Sky Harbor Airport 23.3 Average Mean Temperature (°C) Phoenix Greenway 21.7 Phoenix Encanto Waddell 21.6 21.7arrow_forwardThe Great White Shark. In an article titled “Great White, Deep Trouble” (National Geographic, Vol. 197(4), pp. 2–29), Peter Benchley—the author of JAWS—discussed various aspects of the Great White Shark (Carcharodon carcharias). Data on the number of pups borne in a lifetime by each of 80 Great White Shark females are provided on the WeissStats site. Use the technology of your choice to a. obtain frequency and relative-frequency distributions, using single-value grouping. b. construct and interpret either a frequency histogram or a relativefrequency histogram.arrow_forward
- Cellulon, a manufacturer of home insulation, wants to develop guidelines for builders and consumers on how the thickness of the insulation in the attic of a home and the outdoor temperature affect natural gas consumption. In the laboratory, it varied the insulation thickness and temperature. A few of the findings are:arrow_forwardA deficiency of the trace element selenium in the diet can negatively impact growth, immunity, muscle and neuromuscular function, and fertility. The introduction of selenium supplements to dairy cows is justified when pastures have low selenium levels. Authors of a research paper supplied the following data on milk selenium concentration (mg/L) for a sample of cows given a selenium supplement (the treatment group) and a control sample given no supplement, both initially and after a 9-day period. Initial Measurement Treatment Control 11.4 9.1 9.6 8.7 10.1 9.7 8.5 10.8 10.2 10.9 10.6 10.6 11.9 10.1 9.9 12.3 10.7 8.8 10.2 10.4 10.3 10.9 11.4 10.4 9.3 11.6 10.6 10.9 10.9 8.3 After 9 Days Treatment Control 138.3 9.2 104 8.9 96.4 8.9 89 10.1 88 9.6 103.8 8.6 147.3 10.4 97.1 12.4 172.6 9.2 146.3 9.5 99 8.4 122.3 8.8 103 12.5 117.8 9.1 121.5 93 (a) Use the given data for the treatment group to determine if…arrow_forwardInorganic phosphorous is a naturally occurring element in all plants and animals, with concentrations increasing progressively up the food chain (fruit < vegetables < cereaise nuts < corpse). Geochemical surveys take soil samples to determine phosphorous content (in ppm, parts per million). A high phosphorous content may or may not indicate an ancient burial site, food storage site, or even a garbage dump. Independent random samples from two regions gave the following phosphorous measurements (in ppm). Assume the distribution of phosphorous is mound-shaped and symmetric for these two regions. Region It x n, 15 857 1,551 1,230 875 1,080 2,330 1,850 1,860 2,340 1,080 910 1,130 1,450 1,260 1,010 Region III xi n 14 542 B06 1,230 1,770 790 960 1,650 860 890 640 1,180 1,160 1,050 1,020 A USE SALT (a) Use a caiculator with mean and standard deviation keys to verify that a and s (Round your answers to four decimal places.) ppm ppm ppm ppm (b) Let , be the population mean for x, and let be the…arrow_forward
 Linear Algebra: A Modern IntroductionAlgebraISBN:9781285463247Author:David PoolePublisher:Cengage Learning
 Calculus For The Life SciencesCalculusISBN:9780321964038Author:GREENWELL, Raymond N., RITCHEY, Nathan P., Lial, Margaret L.Publisher:Pearson Addison Wesley,
 Glencoe Algebra 1, Student Edition, 9780079039897...AlgebraISBN:9780079039897Author:CarterPublisher:McGraw Hill