
The graph of average individual delay versus the repair period and use this graph to discuss the effect of the expected repair time on the average delay.
Explanation of Solution
Given:
We have been given the following information:
We have been given the following information:
Total number of lanes = 3,
Mean free flow speed of the highway
Jam density
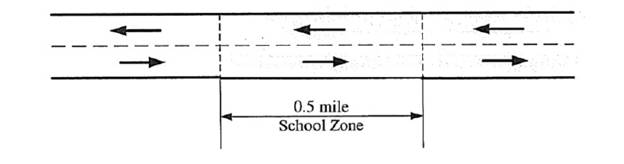
Following is the lay out of the given highway section:
Calculation:For the expected repair period of 1 hour.
We have the following formula for the determination of maximum queue length that will be formed:
Where,
Considering 90 percent of the flow and that the capacity of each lane is 2000 Veh/ h
Substituting the values in the following equation, we have
Themaximum queue length that will be formed is
Now, the total delay, we have the following formula
Where,
And C is the total capacity and can be found as
Now, substituting the values in the required equation, we have
The total delay is
The number of vehicles that will be affected by the incident.
To calculate the number of vehicles that will be affected by the incident can be foundusing the following formula:
Number of vehicles affected =
Substituting the values, we have
The number of vehicles that will be affected by the incident is
To calculate the average individual delay, we have the following formula:
Average individual delay
Substituting the values, we have
The average individual is
For the expected repair period of 1.5 hour.
We have the following formula for the determination of maximum queue length that will be formed:
Where,
Considering 90 percent of the flow and that the capacity of each lane is 2000 Veh/ h
Substituting the values in the following equation, we have
Themaximum queue length that will be formed is
Now, the total delay, we have the following formula
Where,
And C is the total capacity and can be found as
Now, substituting the values in the required equation, we have
The total delay is
The number of vehicles that will be affected by the incident.
To calculate the number of vehicles that will be affected by the incident can be found using the following formula:
Number of vehicles affected =
Substituting the values, we have
The number of vehicles that will be affected by the incident is
To calculate the average individual delay, we have the following formula:
Average individual delay
Substituting the values, we have
Theaverage individualdelay is
For the expected repair period of 2.5 hour.
We have the following formula for the determination of maximum queue length that will be formed:
Where,
Considering 90 percent of the flow and that the capacity of each lane is 2000 Veh/ h
Substituting the values in the following equation, we have
The maximum queue length that will be formed is
Now, the total delay, we have the following formula
Where,
And C is the total capacity and can be found as
Now, substituting the values in the required equation, we have
The total delay is
The number of vehicles that will be affected by the incident.
To calculate the number of vehicles that will be affected by the incident can be found using the following formula:
Number of vehicles affected =
Substituting the values, we have
Therefore, the number of vehicles that will be affected by the incident is
To calculate the average individual delay, we have the following formula:
Average individual delay
Substituting the values, we have
The average individualdelay is
For the expected repair period of 2.75 hour.
We have the following formula for the determination of maximum queue length that will be formed:
Where,
Considering 90 percent of the flow and that the capacity of each lane is 2000 Veh/ h
Substituting the values in the following equation, we have
Therefore, the maximum queue length that will be formed is
Now, the total delay, we have the following formula
Where,
And C is the total capacity and can be found as
Now, substituting the values in the required equation, we have
Therefore, the total delay is
The number of vehicles that will be affected by the incident.
To calculate the number of vehicles that will be affected by the incident can be found using the following formula:
Number of vehicles affected =
Substituting the values, we have
The number of vehicles that will be affected by the incident is
To calculate the average individual delay, we have the following formula:
Average individual delay
Substituting the values, we have
the average individual delay is
For the expected repair period of 3.0 hour.
We have the following formula for the determination of maximum queue length that will be formed:
Where,
Considering 90 percent of the flow and that the capacity of each lane is 2000 Veh/ h
Substituting the values in the following equation, we have
The maximum queue length that will be formed is
Now, the total delay, we have the following formula
Where,
And C is the total capacity and can be found as
Now, substituting the values in the required equation, we have
The total delay is
The number of vehicles that will be affected by the incident.
To calculate the number of vehicles that will be affected by the incident can be found using the following formula:
Number of vehicles affected =
Substituting the values, we have
The number of vehicles that will be affected by the incident is
To calculate the average individual delay, we have the following formula:
Average individual delay
Substituting the values, we have
The average individual delay is
Plot the graph of average individual delay versus the repair period is as follows:
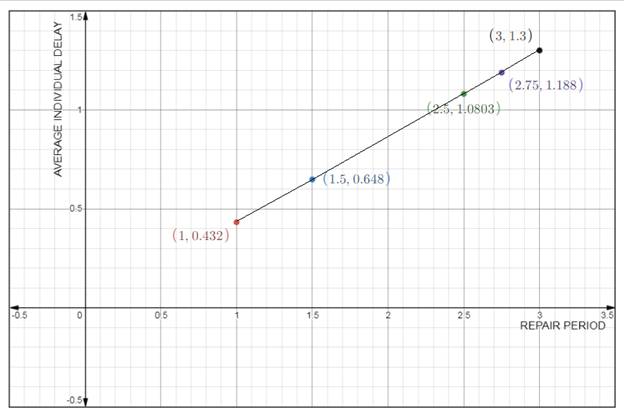
Conclusion:
Therefore, for 1.0 hour : Themaximum queue length that will be formed is
For 1.5hour:
Themaximum queue length that will be formed is
For 2.50hour:
Themaximum queue length that will be formed is
The total delay is
The number of vehicles that will be affected by the incident is
The average individual delayis
For 2.75hour:
Themaximum queue length that will be formed is
The total delay is
The number of vehicles that will be affected by the incident is
The average individual delay is
For 3.0 hour:
Themaximum queue length that will be formed is
The total delay is
The number of vehicles that will be affected by the incident is
The average individual delay is
Want to see more full solutions like this?
Chapter 6 Solutions
Traffic and Highway Engineering

- count period. n, 5, A 24-hour count using a road tube at a rural highway location produces a count of I1,250 actuations. A repre- sentative sample count to classify vehicles resulted in the data shown here: en Data for Problem 2 Number of Axles Per Vehicle Number Observed 157 55 50 33 8. ---«n 1EK 8 TRAFFIC DATA C Based on this sample classification count, how many vehicles were observed during the 24-hour study? 2344 6arrow_forwardA before-and-after speed study was conducted to determine the effectiveness of a series of rumble strips installed approaching a toll plaza to reduce approach speeds to 40 mi/h. The table below shows summarizes the results of the study. Item Average Speed Standard Deviation Sample Size O True Before Study 43.5 mi/h Ⓒ False 4.8 mi/h 120 After Study 40.8 mi/h 5.3 mi/h Answer the following True/False question after performing statistical analysis on the data (be sure to upload the statistical analysis solution to support your answer). The rumble strips effective in reducing average speeds to 40 mi/h. (True or False)? 108arrow_forwardEXAMPLE 4: A 20-mile section of the Cavite Coastal Road had the following reported accidents including property damage only accidents (PDO). It is required to compute the accident rates for injury accidents for a period of 5 years from 1980. (Ans. 69.70) YEAR 1980 1981 1982 1983 1984 FATAL ACCIDENT 3 1 5 8 7 INJURY PROPERTY ACCIDENT DAMAGE 40 52 60 74 96 110 215 170 250 160 AVERAGE DAILY TRAFFIC 12,000 12,500 16,000 13,500 14,000arrow_forward
- Example - Floating car method The data collected from speed and delay studies by floating car method on a stretch of urban road of length 3.5 km, running North-South are given below. Determine the average values of volume, journey speed and running speed & SMS of the traffic stream along either direction. Trip Direction of Journey trip time No. 1234S00 5 6 7 8 N-S S-N N-S S-N N-S S-N N-S S-N Total stop No. of delay vehicles Min-Sec Min-Sec overtaking 6-32 7-14 6-5 7-40 6-10 8-00 6-28 7-30 1-40 1-50 1-30 2-00 1-10 2-22 1-40 1-40 4552 M N N M 3 2 2 3 No. of vehicle overtaken 733L5252 1 No. of vehicles from opposite direction 268 186 280 200 250 170 290 160arrow_forwardSituation III: The table below shows the reported accidents for 1 10-mile highway section of the Macapagal boulevard. Year Ave. daily Traffic 20,500 22,000 23,500 24,000 25,500 7. Compute for the severity ratio Property damage 165 Injury Accidents Fatal Accidents 2000 40 2001 150 45 2002 170 170 50 10 2003 45 2004 160 60 19 8. Compute for the accident rate for injury accidents in HMVM 9. Compute the accident rate in HMVM O69arrow_forwardA researcher was observing traffic along one lane of a rural highway. During a 1 minute time interval, ten vehicles were observed travelling 65, 64, 71, 66, 58, 72, 69, 66, 55 and 62 mph. Calculate the flow rate (vph). Provide your answer to the nearest integer.arrow_forward
- A sample of 100 over-all travel speed was observed on a four-lane, undivided Arterial Street. The sample mean was 35.45 mph, and the standard deviation of the sample was 5.20 mph. Assume that the sample of travel speeds was taken from a normal population. a) Find the percentage of vehicles in the population traveling between 33 and 44 mph. b) Between what limits may the mean of the population be expected to fall for a 95 percent level of confidence?arrow_forwardQUESTION 8 A researcher was positioned at the side of a 2-lane rural highway. He recorded the volume of northbound traffic, aggregated into 15 minute intervals. The recorded volumes were 243, 276, 318 and 490 vehicles for the first, second, third, and fourth 15-minute intervals, respectively. Calculate the peak hour factor. Provide your answer to the nearest hundredths.arrow_forwardThe municipality that controls that arterial road reduced the posted speed limit, hoping to reduce the average speed of the road to 60 km/h. After introducing the new speed limit, the municipality collected a new speed sample (sample size = 220) to calculate the operating speed. The average speed and the standard deviation of the new sample were found to be 61.09 km/h and 8.95 km/h, respectively. Based on this information, answer the following question a) Is the speed reduction (if there is any) statistically significant? b) Was the target speed achieved by introducing the new speed limit?arrow_forward
- TRAVEL TIME AND DELAY STUDIES • The shows data obtained in a travel time study on a section of highway using the moving-vehicle technique. Estimate (a) the travel time and (b) the volume in each direction at this section of the highway Run Direction/ Number Northward 2 4 5 6 7 8 9 10 Southward 3 4 6 7 8 9 10 No. of Vehicles Travel Traveling in Time Opposite Direction (min) 5.25 5.08 5.30 5.15 5.00 5.51 5.38 5.41 5.12 5.31 4.95 4.85 5.00 4.91 4.63 5.11 4.83 4.91 4.95 4.83 100 105 103 110 101 98 97 112 109 107 85 88 95 100 102 90 95 96 98 90 PARKING STUDIES No. of Vehicles That Overtook Test Vehicle 3 1 0 1 3 0 1 0 0 2 1 1 No. of Vehicles Overtaken by Test Vehicle 2 1 1 0 3 1 0 1 2 PROB 1. Data collected at a parking lot indicate that a total of 300 cars park between 8 a.m. and 6 p.m. 10% of these cars are parked for an average of 2 hr, 30% for an average of 4 hr, and the remaining cars are parked for an average of 10 hr. Determine the space-hours of demand at the lot PROB 2. If 10% of…arrow_forwardAt an impaired driver checkpoint, the time required to conduct the impairment test varies (exponentially distributed) depending on the compliance of the driver, but takes 60 seconds on average. If an average of 30 vehicles per hour arrive (according to a Poisson distribution) at the checkpoint, determine the average time spent in the system.arrow_forward7) In studying of traffic flow at a highway toll booth over a course of 60 minutes, it is determined that the arrival and departure rates are deterministic, but not uniform. The arrival rate is found to vary according to the function A(t) = 1.8+0.25t - 0.00312. The departure rate function is u(t) = 1.4 +0 .1lt. In both of these functions, t is in minutes after the beginning of the observation and (t) and „u(t) are in vehicles per minute. At what time does the maximum queue length occur? a) 49.4 min, b) 2.7 min ,c) 19.4 min, d) 60.0 minarrow_forward
 Traffic and Highway EngineeringCivil EngineeringISBN:9781305156241Author:Garber, Nicholas J.Publisher:Cengage Learning