
Mathematics All Around (6th Edition)
6th Edition
ISBN: 9780134434681
Author: Tom Pirnot
Publisher: PEARSON
expand_more
expand_more
format_list_bulleted
Videos
Textbook Question
Chapter 4.3, Problem 10E
Modeling the spread of classified information. Several news organizations have made public a secret report on how to improve the U.S. diplomatic stature in the Middle East. Based on sources (which we cannot reveal), the given graph indicates how the information could have passed among these organizations.
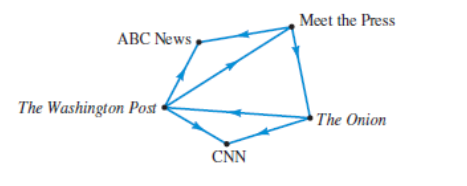
a. Determine which organizations could have first obtained this information.
b. Change the direction of only one edge in the graph so that only the Washington Post could have obtained the information first.
Expert Solution & Answer
Want to see the full answer?
Check out a sample textbook solution
Students have asked these similar questions
What type of graph should be used to represent the following variables? Why do you think so?
a. Have credit card or do not?
b. Eye color
c. Birth place
d. Weight
e. Age
f. Height
g. Sexual orientation
The book The Wall Street Journal. Guide to Information Graphics by Dona M. Wong gives strategies for using graphs and charts to display information effectively. One popular graph discussed is the donut pie chart. The donut pie chart is simply a pie chart with the center removed. A recent Harris Poll asked adults about their opinions regarding whether books should be banned from libraries because of social, language, violent, sexual, or religious content. The responses by education level to the question "Do you think that there are any books which should be banned completely?" are shown in the following donut pie charts.
(a) What feature of Keith's graph makes it difficult to visually compare the responses of those with some college to those shown in the other graphs? (Select all that apply.)
a)The graphs made by Keith and Ramon compare groups across education level.
b)The graphs made by Keith and Ramon are all donut pie charts.
c)The graphs do not have data labels showing the…
15% of the students in Business Department are
specialising in Human Resource Management
,20% in Finance, 35% in Management, and 30% in
Accounting. Which of the following is the best
graphical method to present these data is (are)?
a. Only a bar graph
b. Both a bar graph and a pie chart
C. A line graphs
d. Only a pie chart
Chapter 4 Solutions
Mathematics All Around (6th Edition)
Ch. 4.1 - In Exercise 1-6, determine whether the graph is...Ch. 4.1 - In Exercise 1-6, determine whether the graph is...Ch. 4.1 - In Exercise 1-6, determine whether the graph is...Ch. 4.1 - In Exercise 1-6, determine whether the graph is...Ch. 4.1 - In Exercise 1-6, determine whether the graph is...Ch. 4.1 - In Exercise 1-6, determine whether the graph is...Ch. 4.1 - In Exercises 7-12, use Eulers theorem to decide...Ch. 4.1 - In Exercises 7-12, use Eulers theorem to decide...Ch. 4.1 - In Exercises 7-12, use Eulers theorem to decide...Ch. 4.1 - In Exercises 7-12, use Eulers theorem to decide...
Ch. 4.1 - In Exercises 7-12, use Eulers theorem to decide...Ch. 4.1 - In Exercises 7-12, use Eulers theorem to decide...Ch. 4.1 - In Exercise 13-16, if the given graph is Eulerian,...Ch. 4.1 - In Exercise 13-16, if the given graph is Eulerian,...Ch. 4.1 - In Exercise 13-16, if the given graph is Eulerian,...Ch. 4.1 - In Exercise 13-16, if the given graph is Eulerian,...Ch. 4.1 - In Exercises 17-24, try to give an example of each...Ch. 4.1 - Prob. 18ECh. 4.1 - In Exercises 17-24, try to give an example of each...Ch. 4.1 - In Exercises 17-24, try to give an example of each...Ch. 4.1 - In Exercises 17-24, try to give an example of each...Ch. 4.1 - Prob. 22ECh. 4.1 - Prob. 23ECh. 4.1 - Prob. 24ECh. 4.1 - In Exercise 25-28, remove one edge to make the...Ch. 4.1 - Prob. 26ECh. 4.1 - Prob. 27ECh. 4.1 - In Exercise 25-28, remove one edge to make the...Ch. 4.1 - In Exercise 29-32, try to redraw the given graph...Ch. 4.1 - In Exercise 29-32, try to redraw the given graph...Ch. 4.1 - In Exercise 29-32, try to redraw the given graph...Ch. 4.1 - In Exercise 29-32, try to redraw the given graph...Ch. 4.1 - Finding an efficient route. A taxi driver wants to...Ch. 4.1 - Finding an efficient route. Repeat Exercises 33...Ch. 4.1 - Exercise 35 and 36 are similar to DUCK tour...Ch. 4.1 - Exercise 35 and 36 are similar to DUCK tour...Ch. 4.1 - Represent the maps given in Exercises 37-40 by...Ch. 4.1 - Represent the maps given in Exercises 37-40 by...Ch. 4.1 - Represent the maps given in Exercises 37-40 by...Ch. 4.1 - Represent the maps given in Exercises 37-40 by...Ch. 4.1 - Prob. 41ECh. 4.1 - Prob. 42ECh. 4.1 - Prob. 43ECh. 4.1 - Prob. 44ECh. 4.1 - Prob. 45ECh. 4.1 - Prob. 46ECh. 4.1 - Prob. 47ECh. 4.1 - In Exercises 4548, we give you a group of states....Ch. 4.1 - Finding an efficient route. Because of Michaels...Ch. 4.1 - Prob. 50ECh. 4.1 - Use the technique that we used in Example 7 to do...Ch. 4.1 - Use the technique that we used in Example 7 to do...Ch. 4.1 - Use the technique that we used in Example 7 to do...Ch. 4.1 - Use the technique that we used in Example 7 to do...Ch. 4.1 - If, in tracing a graph, we neither begin nor end...Ch. 4.1 - Examine a number of the graphs that we have drawn...Ch. 4.1 - Can an Eulerian graph have a bridge? In order to...Ch. 4.1 - Consider any graph that has some odd and also some...Ch. 4.1 - Discuss specific examples of ways that...Ch. 4.1 - Prob. 60ECh. 4.1 - Draw a graph that can be colored with only two...Ch. 4.1 - Draw a graph that cannot be colored with two...Ch. 4.1 - Draw a graph that cannot be colored with three...Ch. 4.1 - Can you state what configuration of vertices will...Ch. 4.1 - Different notes on a trumpet are obtained by...Ch. 4.1 - If an instrument has four valves, there are 16...Ch. 4.1 - Assume that the registrar at your school is...Ch. 4.1 - Make up a scheduling problem that would be of some...Ch. 4.2 - Prob. 1ECh. 4.2 - Prob. 2ECh. 4.2 - Prob. 3ECh. 4.2 - Prob. 4ECh. 4.2 - Prob. 5ECh. 4.2 - Prob. 6ECh. 4.2 - Prob. 7ECh. 4.2 - Prob. 8ECh. 4.2 - How many Hamilton circuits are in K7?Ch. 4.2 - How many Hamilton circuits are in K8?Ch. 4.2 - Prob. 11ECh. 4.2 - Prob. 12ECh. 4.2 - Prob. 13ECh. 4.2 - Prob. 14ECh. 4.2 - Prob. 15ECh. 4.2 - Prob. 16ECh. 4.2 - Prob. 17ECh. 4.2 - Prob. 18ECh. 4.2 - Prob. 19ECh. 4.2 - Prob. 20ECh. 4.2 - Prob. 21ECh. 4.2 - Prob. 22ECh. 4.2 - Prob. 23ECh. 4.2 - Prob. 24ECh. 4.2 - In Exercises 23 -28, use the best edge algorithm...Ch. 4.2 - Prob. 26ECh. 4.2 - In Exercise 23 -28, use the best edge algorithm to...Ch. 4.2 - In Exercise 23 -28, use the best edge algorithm to...Ch. 4.2 - Simon Cowell plans a series of live shows from...Ch. 4.2 - ESPN is planning to do a special series called...Ch. 4.2 - Foodandwine.com states that the best ice cream...Ch. 4.2 - In order to try to solve a European financial...Ch. 4.2 - Prob. 33ECh. 4.2 - Prob. 34ECh. 4.2 - Prob. 35ECh. 4.2 - Prob. 36ECh. 4.2 - Prob. 37ECh. 4.2 - Prob. 38ECh. 4.2 - Prob. 39ECh. 4.2 - Prob. 40ECh. 4.2 - Prob. 41ECh. 4.2 - Prob. 42ECh. 4.2 - Prob. 43ECh. 4.2 - Prob. 44.1ECh. 4.2 - Prob. 44.2ECh. 4.2 - Prob. 45.1ECh. 4.2 - Prob. 45.2ECh. 4.2 - Prob. 45.3ECh. 4.2 - Prob. 49ECh. 4.2 - Prob. 51ECh. 4.2 - Prob. 52ECh. 4.3 - In Exercises 1-4, use each graph to find the...Ch. 4.3 - In Exercises 1-4, use each graph to find the...Ch. 4.3 - In Exercises 1-4, use each graph to find the...Ch. 4.3 - In Exercises 1-4, use each graph to find the...Ch. 4.3 - Prob. 5ECh. 4.3 - Prob. 6ECh. 4.3 - Prob. 7ECh. 4.3 - Prob. 8ECh. 4.3 - Modeling the spread of rumours. Ryan, Dwight, Pam,...Ch. 4.3 - Modeling the spread of classified information....Ch. 4.3 - Modeling the flow of paperwork through a...Ch. 4.3 - Modeling the spread of disease. The following...Ch. 4.3 - Prob. 13ECh. 4.3 - Modeling a communication network. An AMBER alert...Ch. 4.3 - Ranking football teams. The given graph shows the...Ch. 4.3 - Ranking American Gladiators. The graph below shows...Ch. 4.3 - Modeling influence. A designer who wishes to...Ch. 4.3 - Prob. 18ECh. 4.3 - Prob. 19ECh. 4.3 - Ranking CrossFit competitors. CrossFit is a...Ch. 4.3 - Prob. 21ECh. 4.3 - Prob. 22ECh. 4.3 - Prob. 23ECh. 4.3 - Prob. 24ECh. 4.3 - Prob. 25ECh. 4.3 - Prob. 26ECh. 4.3 - Prob. 27ECh. 4.3 - Prob. 28ECh. 4.3 - Prob. 29ECh. 4.3 - Communicating Mathematics In the incidence...Ch. 4.3 - Math in Your Life: Between the Numbers The history...Ch. 4.3 - Prob. 32ECh. 4.3 - Prob. 33ECh. 4.3 - Prob. 34ECh. 4.4 - Sharpening Your Skills. In Exercises 1 4, assume...Ch. 4.4 - Sharpening Your Skills. In Exercises 1 4, assume...Ch. 4.4 - Sharpening Your Skills. In Exercises 1 4, assume...Ch. 4.4 - Sharpening Your Skills. In Exercises 1 4, assume...Ch. 4.4 - Sharpening Your Skills. In Exercises 5 8, use the...Ch. 4.4 - Sharpening Your Skills. In Exercises 5 8, use the...Ch. 4.4 - Sharpening Your Skills. In Exercises 5 8, use the...Ch. 4.4 - Sharpening Your Skills. In Exercises 5 8, use the...Ch. 4.4 - Applying What Youve Learned. Planning a festival....Ch. 4.4 - Applying What Youve Learned. Organizing a project....Ch. 4.4 - Applying What Youve Learned. Building a student...Ch. 4.4 - Applying What Youve Learned. Organizing a health...Ch. 4.4 - Applying What Youve Learned. Organizing an...Ch. 4.4 - Communicating Mathematics. Study Figure 4.35 with...Ch. 4.4 - Communicating Mathematics. Write a brief report on...Ch. 4.4 - Challenge yourself. Planning an innovative house....Ch. 4.CR - Section 4.1 Use the preceding graph to answer the...Ch. 4.CR - Section 4.1 Explain how graphs are used to model a...Ch. 4.CR - Section 4.1 Which of the following graphs can be...Ch. 4.CR - Section 4.1 Use Fleurys algorithm to find an Euler...Ch. 4.CR - Section 4.1 Model the following street map with a...Ch. 4.CR - Prob. 6CRCh. 4.CR - Section 4.1 Allison, Branden, Colin, Donny, Erica,...Ch. 4.CR - Section 4.2 Find all Hamilton circuits that begin...Ch. 4.CR - Section 4.2 Use the following weighted graph to...Ch. 4.CR - Section 4.2 Use the following weighted graph to...Ch. 4.CR - Prob. 11CRCh. 4.CR - Prob. 12CRCh. 4.CR - Section 4.3 When are directed graphs rather than...Ch. 4.CR - Section 4.3 A student action committee has been...Ch. 4.CR - Section 4.4 Use the following PERT diagram to...Ch. 4.CR - Section 4.4 Congratulations You are planning your...Ch. 4.CT - Use the preceding graph to answer the following...Ch. 4.CT - Which of the following graphs can be traced? If a...Ch. 4.CT - Use Fleurys algorithm to find an Euler circuit in...Ch. 4.CT - Find all Hamilton circuits that begin at vertex A...Ch. 4.CT - Model the following street map with a graph and...Ch. 4.CT - Prob. 6CTCh. 4.CT - Use the following weighted graph to answer...Ch. 4.CT - Use the following weighted graph to answer...Ch. 4.CT - Use the following weighted graph to answer...Ch. 4.CT - Use the given directed graph to find the following...Ch. 4.CT - Use the given PERT diagram to answer the following...Ch. 4.CT - The following graph models one- and two-stage...
Knowledge Booster


Learn more about
Need a deep-dive on the concept behind this application? Look no further. Learn more about this topic, subject and related others by exploring similar questions and additional content below.Similar questions
- The number of homicides in five states and five Canadian provinces are given below. State/Province Homicides New Jersey 338 Iowa 52 Alabama 426 Texas 1327 California 2579 Nova Scotia 24 Quebec 32 Ontario 178 Manitoba 31 British Columbia 116 a) Construct a graph that allows us to compare the number of homicides in each of these states and provinces. Pay attention to the order you put the states/provinces along the x-axis. Make sure to put them in an order that makes it easier to see the pattern. b) Explain why you chose to put the bars in the order you did.arrow_forward3. Use the graph below to answer the following questions. Distribution of annual household income in the United States (2012 estimate) percent of households Median household income was roughly $51,000. These two groups include households reporting income greater than $200,000 – (approximately 4 percent households). The top 25 percent reported an income grater than $85,000. Source: U.S. Census Bureau, Current Population Survey, 2012 Annual Social and Economie Supplement a) What is the shape of the distribution of annual household income in the U.S.? b) What was the median household income in 2012 and what does it mean? c) Why do you think this graph does not include the mean household income? Do you think the mean would be greater or smaller than the median? Explain.arrow_forwardFor the following line graph, State at least one type of conclusion that could be made from the data provided for the KPI. Suggest one other data source that would provide more information to make data-driven decisions. Explain what information that source would supply. (I used the clustered bar chart) Examples: 1) The completion KPI measures the percentage of South Texas College students who finished their degree or certificate program within six years. From the line graph, it can be seen that the completion rates have remained nearly constant through the years. Data from the THECB was used in this case. 2) Information about the percentage of students who receive credit for attempted courses is available on the South Texas College KPI webpage. According to the data, over the past five years, an increasing number of students have been receiving credit for courses they have attempted. Data on the percentage of students who complete courses, the percentage of students who withdraw…arrow_forward
- On its maiden voyage in 1912, the RMS Titanic struck an iceberg and sank in less than three hours. The table shows survival statistics. Survivors Deceased Women and Children 11 Women and Total Category First Class Second Class Third Class Children Men Men 145 54 119 329 285 24 119 142 417 15 104 105 710 69 214 706 685 1517 899 Crew Total 2223 Source: Statistics of Passengers Rescued and Lost, White Star Momentos 1. Create a graph that lawyers could use to help families of the affected passengers. Explain what type of graph you chose and why. 2. The cruise line released a statement with the headline, "Hundreds of Lives Saved in Titanic Mishap." Create a graph or highlight some data that the cruise line could use to justify this headline. 3. Reflect How do the graphs from steps 1 and 2 show that the way in which you represent information can change people's perceptions? 4. Extend Your Understanding Search the Internet for some examples of data displays that are accurate but misrepresent…arrow_forwardI want you to collect data and use it to make a statistical graph (pie, bar, line, or histogram). You can collect your data or you can use an already existing data set. If you elect to collect your own data, you must clearly detail how the data was collected in your post. If you used an already existing data set, you must cite your source for credit. The graph you construct CANNOT be done by hand for credit.The graph you construct MUST be your own work. If you copy an existing graph or mimic an existing one exactly, you will not receive credit.Your post must contain how the data was collected (or a citation leading us to your data set) AND a picture of the graph you create.arrow_forwardWhat type of graphs( such as bar, histogram, etc) would be best to use to depict the relationship between the following variables? Please state the reason why the chosen graph was selected. how the number of days in theICU(intensive care unit) differ by renal failure status. the association between the number of days in the ICU and the number of hours in the operating room. the association between the number of days in the ICU and the number of hours on the bypass pump? the association between the number of hours in the operating room and the number of hours on a bypass pump? the relationship between the number of days in the ICU and gender?arrow_forward
- In a study of fourth, fifth and sixth graders, the following data were collected on their gender and their primary goal. Primary Goal Gender Good Grades (G) Popularity (P) Good at Sports (S) Row Totals Male (M) 113 53 55 221 Female (F) 132 89 26 247 Column Totals 245 142 81 468 a) Since data were collected for variable(s), the correct graph to make is a b) Which of the following is the correct graph for the above data with Primary Goal grouped by Gender. (If using a screenreader and you cannot see the options, use "message instructor" and include a copy of your graph for hand grading.)arrow_forwardThis graph is from a study evaluating an opioid drug and gender on pain levels. Which of the following effects are present? 10 8 6 I male 4 W female 2 drug placebo One main effect, no interaction effect O One main effect and interaction effect Both main effects, no interaction effect Both main effects and interaction effect No main effects and no interaction effect No main effects and interaction effect O Oarrow_forwardQ5)The graph shows the number of complaints from six different airlines to the Department of Transportation in February 2013. Alaska, Pinnacle, and Airtran Airlines have far fewer complaints reported than American, Delta, and United. Can we conclude that American, Delta, and United are the worst airline carriers since they have the most complaints? Number of complaints 140 120- 100 80 60 40- 20 0 Total Passenger Complaints II. United American Delta Alaska Pinnacle Airtrain Airlines Airlines Airlines Airlines Airlines Airlines Airlinearrow_forward
- Make a table of the most useful variables. Select an appropriate graph type and make a graph using two variables from this data set. Explain why you selected the variables you did and which is the dependent and which is the independent variable.arrow_forwardforms.office.comPages/ResponsePage.aspatidj.ZAR2G-U Which graph represents the equation y= A. B. A The C. D. 10 10 210 9. 8- 10 10arrow_forward2) The data below is the heart rate, in beats per minute, from 18 individuals after two minutes of exercise on a treadmill. 78 87 88 89 90 95 96 97 98 102 | 104 105 107 108| 112 120 132 142 а. Explore this data by producing a graph. You may choose any graph that is appropriate for this type of data and allows you to describe the shape. NEATLY! You may also use a computer to make an appropriate graph. Staple the graph to the back. (You may use technology to create the graph or draw neatly by hand). b. Briefly describe the shape of the distribution. You must use statistical language in your description. c. The average heart rate for all adults is 72 beats per minute. Does this sample suggest that two minutes of exercise on a treadmill significantly increases the average heart rate? Perform a hypothesis test to answer this question. State appropriate hypotheses in symbols. Null: Alternate: Find the Critical Value(s): Find the Test Statistic: Find the p-value: Initial Conclusion:…arrow_forward
arrow_back_ios
arrow_forward_ios
Recommended textbooks for you
 Glencoe Algebra 1, Student Edition, 9780079039897...AlgebraISBN:9780079039897Author:CarterPublisher:McGraw Hill
 Holt Mcdougal Larson Pre-algebra: Student Edition...AlgebraISBN:9780547587776Author:HOLT MCDOUGALPublisher:HOLT MCDOUGAL
 Algebra: Structure And Method, Book 1AlgebraISBN:9780395977224Author:Richard G. Brown, Mary P. Dolciani, Robert H. Sorgenfrey, William L. ColePublisher:McDougal Littell
Glencoe Algebra 1, Student Edition, 9780079039897...
Algebra
ISBN:9780079039897
Author:Carter
Publisher:McGraw Hill
Holt Mcdougal Larson Pre-algebra: Student Edition...
Algebra
ISBN:9780547587776
Author:HOLT MCDOUGAL
Publisher:HOLT MCDOUGAL
Algebra: Structure And Method, Book 1
Algebra
ISBN:9780395977224
Author:Richard G. Brown, Mary P. Dolciani, Robert H. Sorgenfrey, William L. Cole
Publisher:McDougal Littell
what is Research Design, Research Design Types, and Research Design Methods; Author: Educational Hub;https://www.youtube.com/watch?v=LpmGSioXxdo;License: Standard YouTube License, CC-BY