
Concept explainers
Videos
(a)
To graph:
(a)
Explanation of Solution
Given information:
Graph:
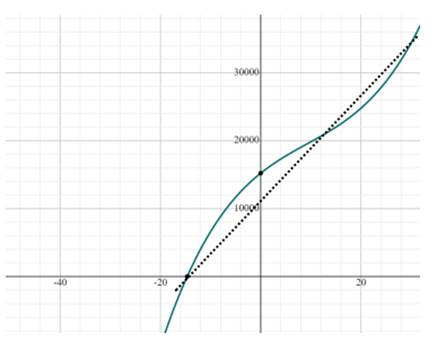
Interpretation: It is an increasing graph.
(b)
Number of employees in education in2000 and 2015.
(b)
Answer to Problem 106E
Number of employees in education in 2000 is 15227 and Number of employees in education in 2015 is 22017.1
Explanation of Solution
Given information:
Number of employees in education in 2000
Number of employees in education in 2015
Number of employees in education in 2015 are
(c)
The model is a good fit
(c)
Answer to Problem 106E
No the model is not a good fit
Explanation of Solution
Given information:
Graph of
In the graph of part (a) there is a large difference between value of the model and original graph curve so it is not a good fit.
Chapter 2 Solutions
PRECALCULUS W/LIMITS:GRAPH.APPROACH(HS)


 Calculus: Early TranscendentalsCalculusISBN:9781285741550Author:James StewartPublisher:Cengage Learning
 Thomas' Calculus (14th Edition)CalculusISBN:9780134438986Author:Joel R. Hass, Christopher E. Heil, Maurice D. WeirPublisher:PEARSON
 Calculus: Early Transcendentals (3rd Edition)CalculusISBN:9780134763644Author:William L. Briggs, Lyle Cochran, Bernard Gillett, Eric SchulzPublisher:PEARSON
 Calculus: Early TranscendentalsCalculusISBN:9781319050740Author:Jon Rogawski, Colin Adams, Robert FranzosaPublisher:W. H. Freeman
 Calculus: Early Transcendental FunctionsCalculusISBN:9781337552516Author:Ron Larson, Bruce H. EdwardsPublisher:Cengage Learning