
Concept explainers
Videos
To draw: the graph of given function f(x) =
Answer to Problem 89E

Explanation of Solution
Given information:
Function
- by applying the leading coefficient test;
- finding the zeros of polynomial;
- plotting sufficient solution;
- Draw a continuous curve through the points.
Calculation:-
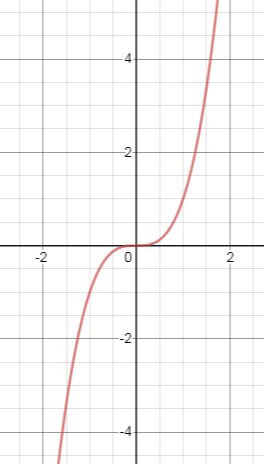
Step: - (a) − Applying the leading coefficient test, we have
In given function, the leading coefficient is +1 (positive) and power of x is 3 (odd) so the graph will drop down to the left and will rise up to right then graph will be something like this
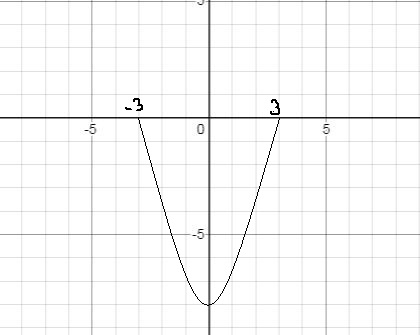
Step (b):- now find the zeros of given function, then
Real Zeros are 3,-3,-3.
Step (c):- since zeros of an equation satisfies the equation so, f(x) = 0 at x = 3 and -3.
Also the multiplicity of zero (-3) is 2 i.e. multiplicity is even so the function will touch the x-axis at x = -3 (if this is odd i.e. 3 or 5 then function will cross the x-axis).
Then graph will be something like this
Step (d):- now drawing the continuous curve by using step (a), (c). We have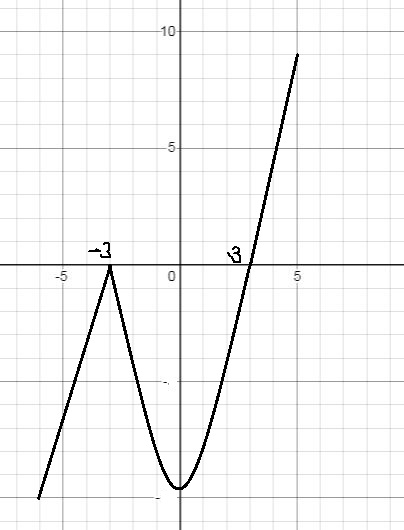
Chapter 2 Solutions
PRECALCULUS W/LIMITS:GRAPH.APPROACH(HS)


 Calculus: Early TranscendentalsCalculusISBN:9781285741550Author:James StewartPublisher:Cengage Learning
 Thomas' Calculus (14th Edition)CalculusISBN:9780134438986Author:Joel R. Hass, Christopher E. Heil, Maurice D. WeirPublisher:PEARSON
 Calculus: Early Transcendentals (3rd Edition)CalculusISBN:9780134763644Author:William L. Briggs, Lyle Cochran, Bernard Gillett, Eric SchulzPublisher:PEARSON
 Calculus: Early TranscendentalsCalculusISBN:9781319050740Author:Jon Rogawski, Colin Adams, Robert FranzosaPublisher:W. H. Freeman
 Calculus: Early Transcendental FunctionsCalculusISBN:9781337552516Author:Ron Larson, Bruce H. EdwardsPublisher:Cengage Learning