Fundamentals Of Cost Accounting (6th Edition)
6th Edition
ISBN: 9781259969478
Author: WILLIAM LANEN, Shannon Anderson, Michael Maher
Publisher: McGraw Hill Education
expand_more
expand_more
format_list_bulleted
Concept explainers
Videos
Textbook Question
Chapter 18, Problem 38E
Partial Productivity Measures
Looking for cost savings in administrative areas, the vice-president for human resources at McMahon Corporation asked his assistant to collect data on the employee cafeterias in the four McMahon locations around the country. After two days, the assistant returned with the following data for the previous year:
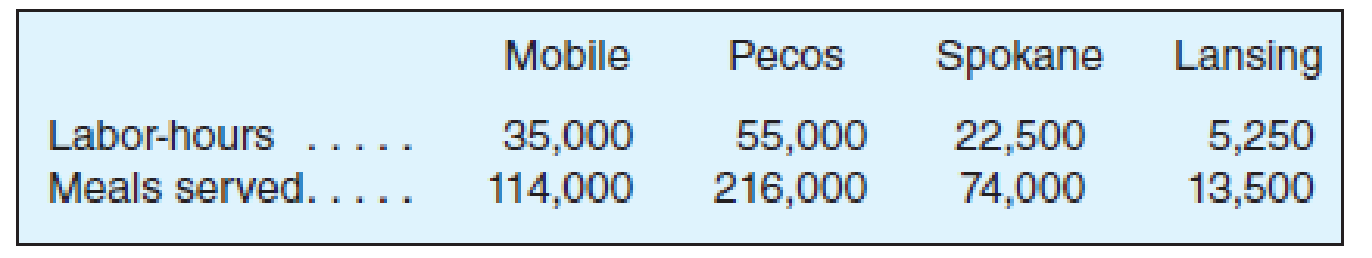
Required
- a. Compute the partial productivity measures for labor for the four locations.
- b. Comment on the results. Are there factors other than efficiency that might affect the results?
Expert Solution & Answer
Want to see the full answer?
Check out a sample textbook solution
Students have asked these similar questions
The Westfield branch of Security Home Bank submitted the following cost data for last year:
Teller wages
Assistant branch manager salary
Branch manager salary
Total
Virtually all other costs of the branch-rent, depreciation, utilities, and so on-are organization-sustaining costs that cannot be
meaningfully assigned to individual customer transactions such as depositing checks.
In addition to the cost data above, the employees of the Westfield branch were interviewed concerning how their time was
distributed last year across the activities included in the activity-based costing study. The results of those interviews appear below:
Teller wages
Assistant branch manager salary
Branch manager salary
$ 144,000
74,000
90,000
$ 308,000
Activity
Opening accounts
Processing deposits and withdrawals
Processing other customer transactions
Distribution of Resource Consumption Across Activities
Processing
Deposits and
Withdrawals
75%
15%
0%
Opening
Accounts
4%
15%
4%
Activity Cost Pool
Opening…
Looking for cost savings in administrative areas, the vice-president for human resources at McMahon Corporation asked his assistant to collect data on the employee cafeterias in the four McMahon locations around the country. After two days, the assistant returned with the following data for the previous year.
Mobile
Pecos
Spokane
Lansing
Labor-hours
35,500
58,800
24,100
6,000
Meals served
111,000
217,000
77,000
13,300
Required:
a. Compute the partial productivity measures for labor for the four locations. (Round your answers to 3 decimal places.)
Looking for cost savings in administrative areas, the vice-president for human
resources at McMahon Corporation asked his assistant to collect data on the
employee cafeterias in the four McMahon locations around the country. After two
days, the assistant returned with the following data for the previous year.
Mobile
Lansing
Spokane
23,500
Реcos
Labor-hours
37,300
56,300
5,400
Meals served
114,000
222,000
79,000
13,900
Required:
a. Compute the partial productivity measures for labor for the four locations. (Round
your answers to 3 decimal places.)
Partial Labor
Location
Productivity
Mobile
Ресos
Spokane
Lansing
Chapter 18 Solutions
Fundamentals Of Cost Accounting (6th Edition)
Ch. 18 - Why is it important for management accountants to...Ch. 18 - A balanced scorecard is a set of two or more...Ch. 18 - What is a business model?Ch. 18 - What are the advantages of financial measures of...Ch. 18 - Prob. 5RQCh. 18 - Why do effective performance evaluation systems...Ch. 18 - What is benchmarking?Ch. 18 - Prob. 8RQCh. 18 - Prob. 9RQCh. 18 - Prob. 10RQ
Ch. 18 - Prob. 11RQCh. 18 - Prob. 12RQCh. 18 - Prob. 13RQCh. 18 - Prob. 14RQCh. 18 - Prob. 15RQCh. 18 - Prob. 16CADQCh. 18 - Prob. 17CADQCh. 18 - Prob. 18CADQCh. 18 - Prob. 19CADQCh. 18 - Prob. 20CADQCh. 18 - Prob. 21CADQCh. 18 - Prob. 22CADQCh. 18 - Prob. 23CADQCh. 18 - Prob. 24CADQCh. 18 - Strategy and Management Accounting Systems Joes...Ch. 18 - Business Strategy Classification Consider the...Ch. 18 - Prob. 27ECh. 18 - Prob. 28ECh. 18 - Prob. 29ECh. 18 - Prob. 30ECh. 18 - Balanced Scorecards and Strategy Maps Crane...Ch. 18 - TechMasters, Inc., has the following mission...Ch. 18 - Benchmarks Match each of the following specific...Ch. 18 - Benchmarks Match each of the following specific...Ch. 18 - Prob. 35ECh. 18 - Manufacturing Cycle Time and Efficiency Bell ...Ch. 18 - Prob. 37ECh. 18 - Partial Productivity Measures Looking for cost...Ch. 18 - Partial Productivity Measures As the cost...Ch. 18 - Prob. 40ECh. 18 - Prob. 41ECh. 18 - Specifying Nonfinancial Measures Write a memo to...Ch. 18 - Manufacturing Cycle Time and Efficiency A...Ch. 18 - Prob. 44ECh. 18 - Core Assets and Capabilities Consider the...Ch. 18 - Write a memo discussing the advantages of each...Ch. 18 - Balanced Scorecards and Strategy Maps Hill Street...Ch. 18 - Balanced Scorecards and Strategy Maps Monroe...Ch. 18 - Benchmarks Write a report to the CEO of Delta...Ch. 18 - Prob. 50PCh. 18 - Performance Measures, Drawing a Business Model...Ch. 18 - Performance Measures, Drawing a Business Model...Ch. 18 - Functional Measures Write a report to the...Ch. 18 - Prob. 54PCh. 18 - Operational Performance Measures Zuma Company...Ch. 18 - Objective and Subjective Performance Measures A...Ch. 18 - Operational Performance Measures Mid-States Metal...Ch. 18 - Prob. 58PCh. 18 - Prob. 59PCh. 18 - Prob. 60PCh. 18 - Balanced Scorecards and Strategy Maps Following...
Knowledge Booster


Learn more about
Need a deep-dive on the concept behind this application? Look no further. Learn more about this topic, accounting and related others by exploring similar questions and additional content below.Similar questions
- In 20x2, Choctaw Company implements a new process affecting labor and materials. The following reported data are provided to evaluate the effect on the companys productivity: Required: 1. Calculate the productivity profile for 20x1. 2. Calculate the productivity profile for 20x2, and comment on the effect of the new production and assembly process. 3. What if the labor hours used in 20x2 were 112,500? What does comparison of the 20x1 and 20x2 profiles now communicate?arrow_forwardRefer to the data in Exercise 7.18. When the capacity of the HR Department was originally established, the normal usage expected for each department was 20,000 direct labor hours. This usage is also the amount of activity planned for the two departments in Year 1 and Year 2. Required: 1. Allocate the costs of the HR Department using the direct method and assuming that the purpose is product costing. 2. Allocate the costs of the HR Department using the direct method and assuming that the purpose is to evaluate performance.arrow_forwardTwo departments within Cougar Gear Inc. are Production and Sales. Each department has a unique scorecard, as follows: The Production Department scorecard focuses on the learning and growth and internal processes perspectives. The Sales Department scorecard focuses on the learning and growth and customer perspectives. Both scorecards have the learning and growth performance metrics of median training hours per employee and average employee tenure. The Production scorecard has the unique metrics of production time per unit and number of production shutdowns. The Sales scorecard has the unique metrics of percentage of customers who shop again and online customer satisfaction rating. The performance targets for each metric are shown in the tan boxes just under the performance metrics. The actual achieved metrics are shown in the red boxes just below the tan boxes. When evaluating both departments, Cougar Gears management looks at the median training hours per employee and average employee tenure metrics and subsequently decides to give the Sales Department a large bonus while giving the Production Department a minimal bonus. a. Determine and define the type of cognitive bias Cougar Gears management has exhibited in this instance. b. Determine which department would have received the larger bonus had the companys management not been biased in the evaluation. c. Discuss one advantage and one disadvantage of using unique balanced scorecards for different departments or divisions of a company.arrow_forward
- Classify each of the following performance measures into the balanced scorecard perspective to which it relates: financial perspective, internal operations perspective, learning and growth perspective, or customer perspective. A. Employee satisfaction surveys B. Units of waste per production process, uniformity of products and inventory control C. Number of energy-efficient bulbs replaced D. Management training course certificates awarded E. Divisional profit F. Number of customer referralsarrow_forwardA manufacturing company has two service and two production departments. Human Resources and Machine Repair are the service departments. The production departments are Grinding and Polishing. The following data have been estimated for next years operations: The direct charges identified with each of the departments are as follows: The human resources department services all departments of the company, and its costs are allocated using the numbers of employees within each department, while machine repair costs are allocable to Grinding and Polishing on the basis of machine hours. 1. Distribute the service department costs, using the direct method. 2. Distribute the service department costs, using the sequential distribution method, with the department servicing the greatest number of other departments distributed first.arrow_forwardRandy Harris, controller, has been given the charge to implement an advanced cost management system. As part of this process, he needs to identify activity drivers for the activities of the firm. During the past four months, Randy has spent considerable effort identifying activities, their associated costs, and possible drivers for the activities costs. Initially, Randy made his selections based on his own judgment using his experience and input from employees who perform the activities. Later, he used regression analysis to confirm his judgment. Randy prefers to use one driver per activity, provided that an R2 of at least 80 percent can be produced. Otherwise, multiple drivers will be used, based on evidence provided by multiple regression analysis. For example, the activity of inspecting finished goods produced an R2 of less than 80 percent for any single activity driver. Randy believes, however, that a satisfactory cost formula can be developed using two activity drivers: the number of batches and the number of inspection hours. Data collected for a 14-month period are as follows: Required: 1. Calculate the cost formula for inspection costs using the two drivers, inspection hours and number of batches. Are both activity drivers useful? What does the R2 indicate about the formula? 2. Using the formula developed in Requirement 1, calculate the inspection cost when 300 inspection hours are used and 30 batches are produced. Prepare a 90 percent confidence interval for this prediction.arrow_forward
- Communications Jamarcus Bradshaw, plant manager of Georgia Paper Companys papermaking mill, was looking over the cost of production reports for July and August for the Papermaking Department. The reports revealed the following: Jamarcus was concerned about the increased cost per ton from the output of the department. As a result, he asked the plant controller to perform a study to help explain these results. The controller, Leann Brunswick, began the analysis by performing some interviews of key plant personnel in order to understand what the problem might be. Excerpts from an interview with Len Tyson, a paper machine operator, follow: Len: We have two papermaking machines in the department. I have no data, but I think paper machine No. 1 is applying too much pulp and, thus, is wasting both conversion and materials resources. We haven't had repairs on paper machine No. 1 in a while. Maybe this is the problem. Leann: How does too much pulp result in wasted resources? Len: Well, you see, if too much pulp is applied, then we will waste pulp material. The customer will not pay for the extra product; we just use more material to make the product. Also, when there is too much pulp, the machine must be slowed down in order to complete the drying process. This results in additional conversion costs. Leann: Do you have any other suspicions? Len: Well, as you know, we have two productsgreen paper and yellow paper. They are identical except for the color. The color is added to the papermaking process in the paper machine. I think that during August these two color papers have been behaving very differently. I don't have any data, but it just seems as though the amount of waste associated with the green paper has increased. Leann: Why is this? Len: I understand that there has been a change in specifications for the green paper, starting near the beginning of August. This change could be causing the machines to run poorly when making green paper. If this is the case, the cost per ton would increase for green paper. Leann also asked for a database printout providing greater detail on Augusts operating results. September 9 Requested by: Leann Brunswick Papermaking DepartmentAugust detail Prior to preparing a report, Leann resigned from Georgia Paper Company to start her own business. You have been asked to take the data that Leann collected, and write a memo to Jamarcus Bradshaw with a recommendation to management. Your memo should include analysis of the August data to determine whether the paper machine or the paper color explains the increase in the unit cost from July. Include any supporting schedules that are appropriate. Round any calculations to the nearest cent.arrow_forwardThayne Company has 30 clerks that work in its Accounts Payable Department. A study revealed the following activities and the relative time demanded by each activity: Required: Classify the four activities as value-added or non-value-added, and calculate the clerical cost of each activity. For non-value-added activities, indicate why they are non-value-added.arrow_forwardThe controller of Emery, Inc. has computed quality costs as a percentage of sales for the past 5 years (20X1 was the first year the company implemented a quality improvement program). This information is as follows: Required: 1. Prepare a trend graph for total quality costs. Comment on what the graph has to say about the success of the quality improvement program. 2. Prepare a graph that shows the trend for each quality cost category. What does the graph have to say about the success of the quality improvement program? Does this graph supply more insight than the total cost trend graph does? 3. Prepare a graph that compares the trend in relative control costs versus relative failure costs. Comment on the significance of this trend.arrow_forward
- Big Mikes, a large hardware store, has gathered data on its overhead activities and associated costs for the past 10 months. Nizam Sanjay, a member of the controllers department, believes that overhead activities and costs should be classified into groups that have the same driver. He has decided that unloading incoming goods, counting goods, and inspecting goods can be grouped together as a more general receiving activity, since these three activities are all driven by the number of receiving orders. The 10 months of data shown below have been gathered for the receiving activity. Required: 1. Prepare a scattergraph, plotting the receiving costs against the number of purchase orders. Use the vertical axis for costs and the horizontal axis for orders. 2. Select two points that make the best fit, and compute a cost formula for receiving costs. 3. Using the high-low method, prepare a cost formula for the receiving activity. 4. Using the method of least squares, prepare a cost formula for the receiving activity. What is the coefficient of determination?arrow_forwardEthics in Action In August, Lannister Company introduced a new performance measurement system in manufacturing operations. One of the new performance measures is lead time, which is determined by tagging a random sample of items with a log sheet throughout the month. The log sheets recorded the time that the sample items started production and the time that they ended production, as well as all steps in between. At the end of the month, the controller collected the log sheets and computed the average lead time of the tagged products. This number was reported to central management and was used to evaluate the performance of the plant manager. Because of the poor lead time results reported for August, the plant was under extreme pressure to reduce lead time in September. The following memo was intercepted by the controller. Date: September 3 To: Hourly Employees From: Plant Manager During last month, you may have noticed that some of the products were tagged with a log sheet. This sheet records the time that a product enters production and the time that it leaves production. The difference between these two times is termed the lead time. Our plant is evaluated on improving lead time. From now on, I ask all of you to keep an eye out for the tagged items. When you see a tagged item, it is to receive special attention. Work on that item first, and then immediately move it to the next operation. Under no circumstances should tagged items wait on any other work that you have. Naturally, report accurate information. I insist that you record the correct times on the log sheet as the product goes through your operations. How should the controller respond to this discovery?arrow_forwardPareto chart and cost of quality report for a manufacturing company The president of Mission Inc. has been concerned about the growth in costs over the last several years. The president asked the controller to perform an activity analysis to gain a better insight into these costs. The activity analysis revealed the following: The production process is complicated by quality problems, requiring the production manager to expedite production and dispose of scrap. Instructions 1. Prepare a Pareto chart of the company activities. 2. Classify the activities into prevention, appraisal, internal failure, external failure, and not costs of quality (producing product). Classify the activities into value-added and non-value-added activities. 3. Use the activity cost information to determine the percentages of total costs that are prevention, appraisal, internal failure, external failure, and not costs of quality. 4. Determine the percentages of total costs that are value-added and non-value-added. 5. Interpret the information.arrow_forward
arrow_back_ios
SEE MORE QUESTIONS
arrow_forward_ios
Recommended textbooks for you
 Principles of Cost AccountingAccountingISBN:9781305087408Author:Edward J. Vanderbeck, Maria R. MitchellPublisher:Cengage Learning
 Managerial AccountingAccountingISBN:9781337912020Author:Carl Warren, Ph.d. Cma William B. TaylerPublisher:South-Western College Pub
 Cornerstones of Cost Management (Cornerstones Ser...AccountingISBN:9781305970663Author:Don R. Hansen, Maryanne M. MowenPublisher:Cengage Learning
 Managerial Accounting: The Cornerstone of Busines...AccountingISBN:9781337115773Author:Maryanne M. Mowen, Don R. Hansen, Dan L. HeitgerPublisher:Cengage Learning
 Financial And Managerial AccountingAccountingISBN:9781337902663Author:WARREN, Carl S.Publisher:Cengage Learning,
 Principles of Accounting Volume 2AccountingISBN:9781947172609Author:OpenStaxPublisher:OpenStax College
Principles of Cost Accounting
Accounting
ISBN:9781305087408
Author:Edward J. Vanderbeck, Maria R. Mitchell
Publisher:Cengage Learning
Managerial Accounting
Accounting
ISBN:9781337912020
Author:Carl Warren, Ph.d. Cma William B. Tayler
Publisher:South-Western College Pub
Cornerstones of Cost Management (Cornerstones Ser...
Accounting
ISBN:9781305970663
Author:Don R. Hansen, Maryanne M. Mowen
Publisher:Cengage Learning
Managerial Accounting: The Cornerstone of Busines...
Accounting
ISBN:9781337115773
Author:Maryanne M. Mowen, Don R. Hansen, Dan L. Heitger
Publisher:Cengage Learning
Financial And Managerial Accounting
Accounting
ISBN:9781337902663
Author:WARREN, Carl S.
Publisher:Cengage Learning,
Principles of Accounting Volume 2
Accounting
ISBN:9781947172609
Author:OpenStax
Publisher:OpenStax College
What is Cost Allocation? Definition & Process; Author: FloQast;https://www.youtube.com/watch?v=hLhvvHvZ3JM;License: Standard Youtube License