Concept explainers
Videos
The graph below, called a
From the graph, it appears that the data follow a linear relation.
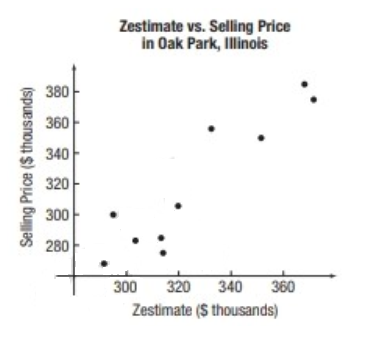
Use your equation to predict the selling price of a home whose zestimate is
Pick two points from the scatter diagram. Treat the zestimate as the value of
Want to see the full answer?
Check out a sample textbook solution
Chapter F Solutions
Precalculus: Concepts Through Functions, A Unit Circle Approach to Trigonometry (4th Edition)


- Heart Disease In a certain country, the number of deaths due to heart disease decreased from 235 in one year to 221 in the next year. What percentage decrease in deaths due to heart disease does this represent?arrow_forwardPlease help. I will rate!arrow_forwardHELP ASAP!!!! #30, #31, #32arrow_forward
- #4. iii and iv. Thanks.arrow_forward#43 … thanksarrow_forwardThe profit (P) realized by a company varies directly as the number of products it sells (s). If a company makes a profit of $2850 on the sale of 150 products, what is the profit when the company sells 1500 products? O A. $285,000 O B. $78,000 O C. $36,500 O D. $29,750 O E. $28,500arrow_forward
 Algebra: Structure And Method, Book 1AlgebraISBN:9780395977224Author:Richard G. Brown, Mary P. Dolciani, Robert H. Sorgenfrey, William L. ColePublisher:McDougal Littell
 Functions and Change: A Modeling Approach to Coll...AlgebraISBN:9781337111348Author:Bruce Crauder, Benny Evans, Alan NoellPublisher:Cengage Learning
 Calculus For The Life SciencesCalculusISBN:9780321964038Author:GREENWELL, Raymond N., RITCHEY, Nathan P., Lial, Margaret L.Publisher:Pearson Addison Wesley,