
Concept explainers
Videos
Mental Tasks and Drugs. In the text Statistical Theory and Methodology in Science and Engineering (New York: Wiley. I960). K. A. Brownlee provides data on an experiment involving a person's ability to perform a mental task before and after taking one of four drugs. Fifty-six subjects performed a task that involved mental addition. The subjects were then randomly divided into four groups. Each group drank a beverage containing one of four drugs, labeled A, B, C, and D. After a period of time for the drugs to take effect, each subject repeated the mental addition test. We want to relate the after test score (after) to the before test score (before) and the drug that was taken. The data from the experiment are presented in the following table.
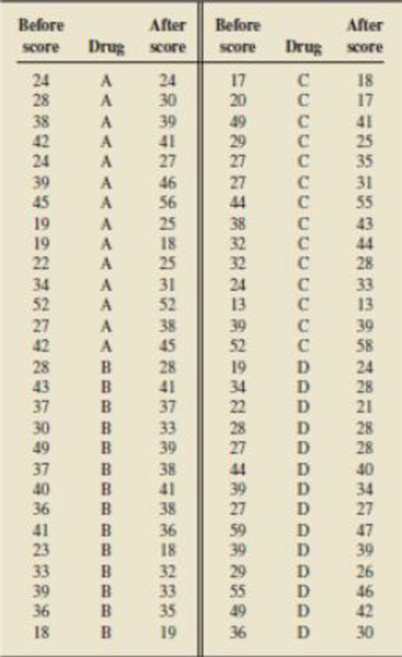
In this study, the drug labeled B was a placebo, that is, it contained no drug and should have no effect on a person’s ability to perform a mental task. Define three indicator variables as follows:
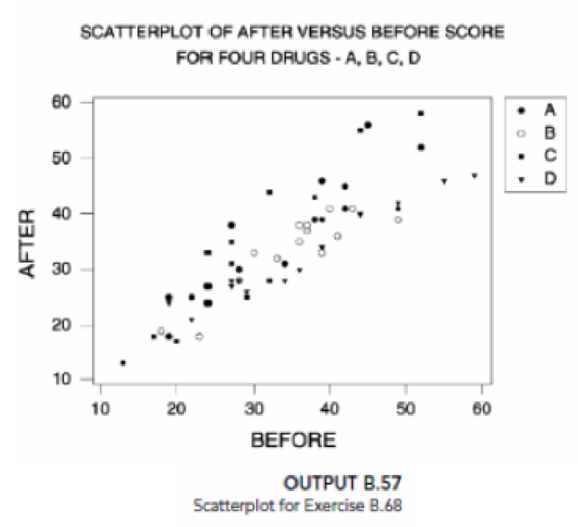
- a. Output B.57 on page B-93 provides a plot of after versus before, using a different plot symbol for each drug. Bases on this plot, does it appear that drug is a useful predictor variable? Explain your answer.
- b. We obtained the regression analysis of after on before and the three indicator variables druga, drugc, and drugd, as shown in Output B.55 on page B-93. Conduct the t-tests for the individual utility of the four predictor variables at the 5% level of significance. Interpret your results.
- c. Explain what the t-test for the utility of the indicator variable druga means in terms of comparing the effect of drug A to the effect of the placebo on the after mental task scores.
- d. Which drugs have on effect on the after mental task score that is different from the placebo?
- e. Based on Output B.58, obtain 1he regression equations relating after to before for each of the four drugs.
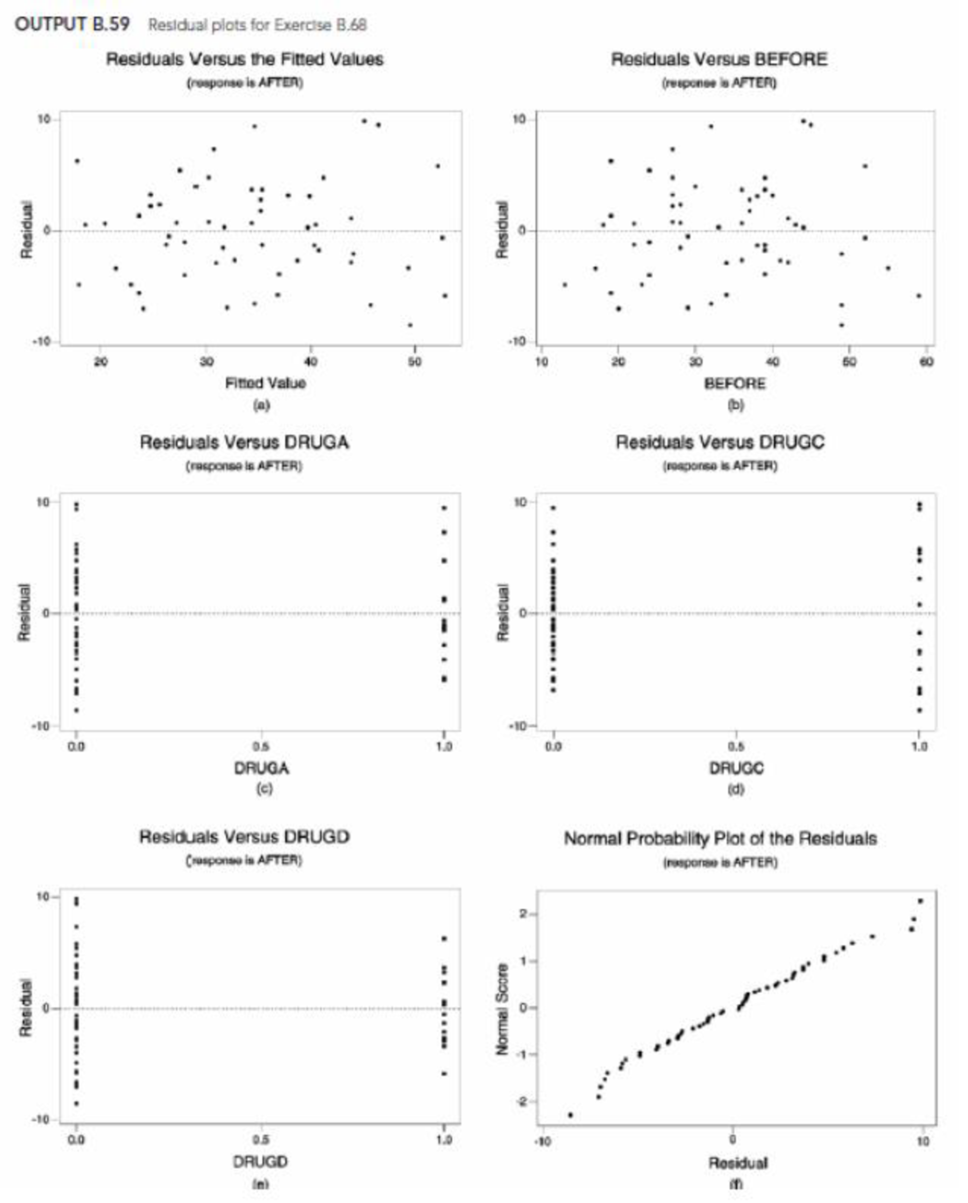
- f. Outputs B.59(a)–(f) provide, respectively, plots of residuals versus fitted values, residuals versus before, and residuals versus each indicator variable, and a normal probability plot of the residuals. Perform a residual analysis to assess the appropriateness of the regression equation, constancy of the conditional standard deviations, and normality of the conditional distributions. Check for outliers and influential observations.
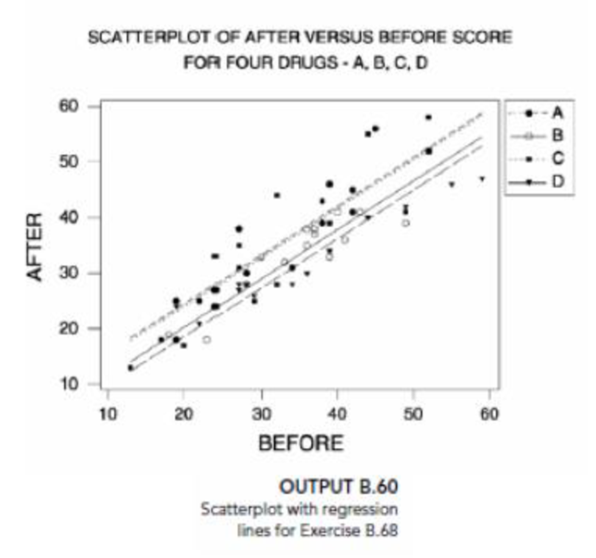
- g. Output B.60 on page B-95 provides a
scatterplot of after versus before with the regression lines for the four drugs. Based on this output and your residual analysis in part (f), do you feel that this model fits the data well? Explain your answer. - h. To check for possible interactions between the before score and. the drug, we obtained the regression analysis of after on before, druga, drugc, drugd, druga·before, drugc·before and drugd·before. The output is in Output B.61 on page B-96. Is there an interaction between drug and before, that is, are any of the cross-product terms useful predictor variables in the regression equation that contains the other terms in the model? Use α = 0.05.
Regression Analysis: AFTER versus BEFORE, DRUDA, DRUGC, DRUGD
Analysis of Variance
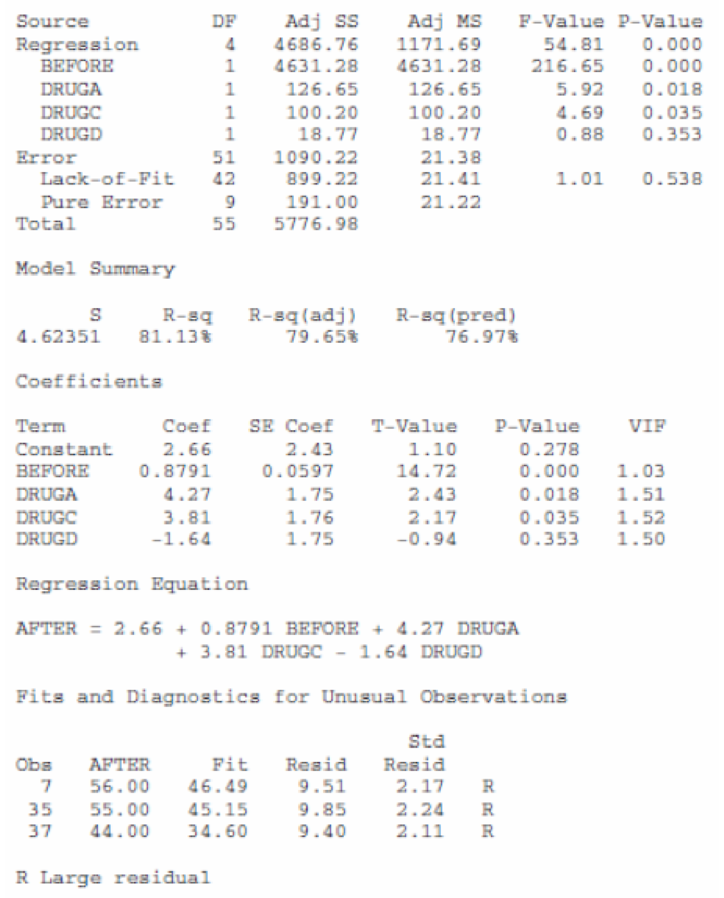
OUTPUT B.58 Regression output for Exercise B.68
Regression Analysis: AFTER versus BEFORE, DRUDA, DRUGC, DRUGD, DRUGA*BEF, DRUGC*BEF, …
Analysis of Variance
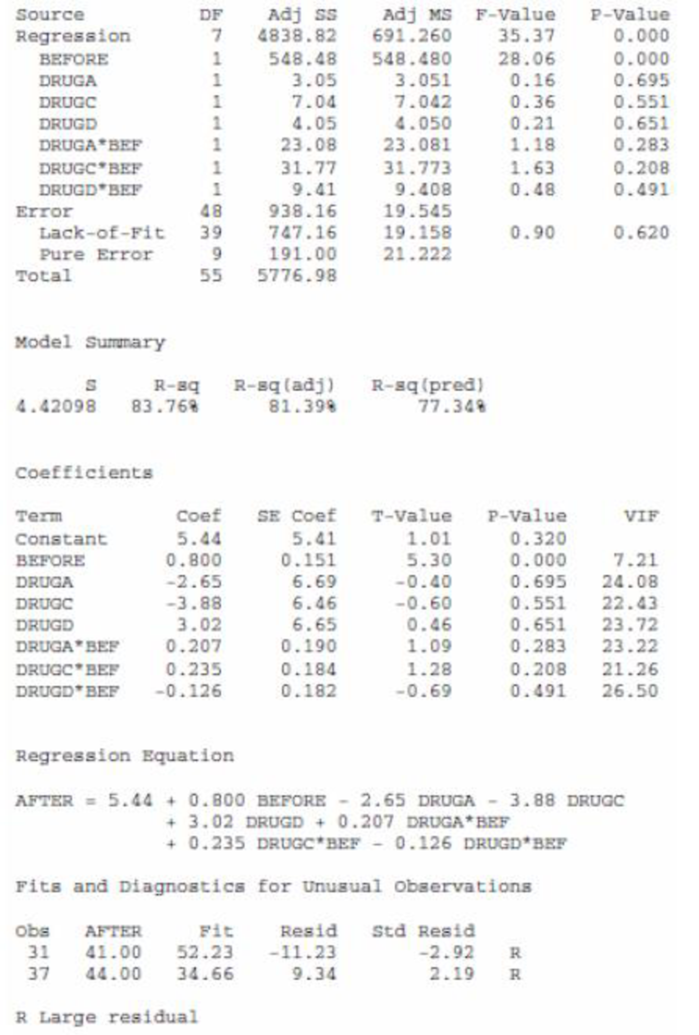
OUTPUT B.61 Regression output For Exercise B.68
Want to see the full answer?
Check out a sample textbook solution
Chapter B Solutions
Introductory Statistics (10th Edition)


 Functions and Change: A Modeling Approach to Coll...AlgebraISBN:9781337111348Author:Bruce Crauder, Benny Evans, Alan NoellPublisher:Cengage Learning
 Calculus For The Life SciencesCalculusISBN:9780321964038Author:GREENWELL, Raymond N., RITCHEY, Nathan P., Lial, Margaret L.Publisher:Pearson Addison Wesley,
 Glencoe Algebra 1, Student Edition, 9780079039897...AlgebraISBN:9780079039897Author:CarterPublisher:McGraw Hill