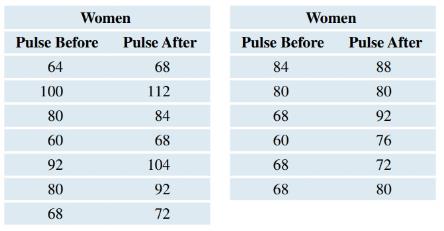
Females’ Pulse Rates before and after a Fright (Example 17) In a statistics class taught by one of the authors, students took their pulses before and after being frightened. The frightening event was having the teacher scream and run from one side of the room to the other. The pulse rates (beats per minute) of the women before and after the scream were obtained separately and are shown in the table. Treat this as though it were a random sample of female community college students. Test the hypothesis that the mean of college women’s pulse rates is higher after a fright, using a significance level of 0.05 . See page 501 for guidance.
Females’ Pulse Rates before and after a Fright (Example 17) In a statistics class taught by one of the authors, students took their pulses before and after being frightened. The frightening event was having the teacher scream and run from one side of the room to the other. The pulse rates (beats per minute) of the women before and after the scream were obtained separately and are shown in the table. Treat this as though it were a random sample of female community college students. Test the hypothesis that the mean of college women’s pulse rates is higher after a fright, using a significance level of 0.05 . See page 501 for guidance.
Females’ Pulse Rates before and after a Fright (Example 17) In a statistics class taught by one of the authors, students took their pulses before and after being frightened. The frightening event was having the teacher scream and run from one side of the room to the other. The pulse rates (beats per minute) of the women before and after the scream were obtained separately and are shown in the table. Treat this as though it were a random sample of female community college students. Test the hypothesis that the mean of college women’s pulse rates is higher after a fright, using a significance level of
0.05
. See page 501 for guidance.
Definition Definition Measure of central tendency that is the average of a given data set. The mean value is evaluated as the quotient of the sum of all observations by the sample size. The mean, in contrast to a median, is affected by extreme values. Very large or very small values can distract the mean from the center of the data. Arithmetic mean: The most common type of mean is the arithmetic mean. It is evaluated using the formula: μ = 1 N ∑ i = 1 N x i Other types of means are the geometric mean, logarithmic mean, and harmonic mean. Geometric mean: The nth root of the product of n observations from a data set is defined as the geometric mean of the set: G = x 1 x 2 ... x n n Logarithmic mean: The difference of the natural logarithms of the two numbers, divided by the difference between the numbers is the logarithmic mean of the two numbers. The logarithmic mean is used particularly in heat transfer and mass transfer. ln x 2 − ln x 1 x 2 − x 1 Harmonic mean: The inverse of the arithmetic mean of the inverses of all the numbers in a data set is the harmonic mean of the data. 1 1 x 1 + 1 x 2 + ...
Need a deep-dive on the concept behind this application? Look no further. Learn more about this topic, statistics and related others by exploring similar questions and additional content below.
Hypothesis Testing - Solving Problems With Proportions; Author: The Organic Chemistry Tutor;https://www.youtube.com/watch?v=76VruarGn2Q;License: Standard YouTube License, CC-BY
Hypothesis Testing and Confidence Intervals (FRM Part 1 – Book 2 – Chapter 5); Author: Analystprep;https://www.youtube.com/watch?v=vth3yZIUlGQ;License: Standard YouTube License, CC-BY


 Calculus For The Life SciencesCalculusISBN:9780321964038Author:GREENWELL, Raymond N., RITCHEY, Nathan P., Lial, Margaret L.Publisher:Pearson Addison Wesley,
 Glencoe Algebra 1, Student Edition, 9780079039897...AlgebraISBN:9780079039897Author:CarterPublisher:McGraw Hill
 Holt Mcdougal Larson Pre-algebra: Student Edition...AlgebraISBN:9780547587776Author:HOLT MCDOUGALPublisher:HOLT MCDOUGAL
 College Algebra (MindTap Course List)AlgebraISBN:9781305652231Author:R. David Gustafson, Jeff HughesPublisher:Cengage Learning