
Intro Stats, Books a la Carte Edition (5th Edition)
5th Edition
ISBN: 9780134210285
Author: Richard D. De Veaux, Paul Velleman, David E. Bock
Publisher: PEARSON
expand_more
expand_more
format_list_bulleted
Concept explainers
Videos
Textbook Question
Chapter 9, Problem 18E
More hill races Here is the regression for the women’s records for the same Scottish hill races we considered in Exercise 14:
Dependent variable is: Women’s Time (mins)
R-squared = 96.7% s = 10.06
| Variable | Coefficient |
| Intercept | –11.6545 |
| Climb (m) | 0.045195 |
| Distance | 4.43427 |
- a) Compare the regression model for the women’s records with that found for the men’s records in Exercise 14.
Here’s a
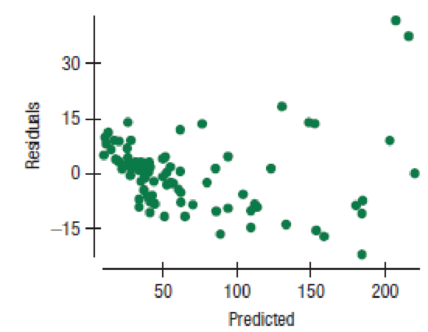
- b) Discuss the residuals and what they say about the assumptions and conditions for this regression.
Expert Solution & Answer
Want to see the full answer?
Check out a sample textbook solution
Chapter 9 Solutions
Intro Stats, Books a la Carte Edition (5th Edition)
Ch. 9.4 - Recall the regression example in Chapter 7 to...Ch. 9.4 - Prob. 2JCCh. 9.4 - Prob. 3JCCh. 9 - Housing prices The following regression model was...Ch. 9 - Candy sales A candy maker surveyed chocolate bars...Ch. 9 - Prob. 3ECh. 9 - Prob. 4ECh. 9 - Prob. 5ECh. 9 - Prob. 6ECh. 9 - Movie profits once more Look back at the...
Ch. 9 - Prob. 8ECh. 9 - Prob. 9ECh. 9 - More indicators For each of these potential...Ch. 9 - Interpretations A regression performed to predict...Ch. 9 - Prob. 12ECh. 9 - Prob. 13ECh. 9 - Scottish hill races Hill runningraces up and down...Ch. 9 - Prob. 15ECh. 9 - Candy bars per serving: calories A student...Ch. 9 - Prob. 17ECh. 9 - More hill races Here is the regression for the...Ch. 9 - Prob. 19ECh. 9 - Home prices II Here are some diagnostic plots for...Ch. 9 - Admin performance The AFL-CIO has undertaken a...Ch. 9 - GPA and SATs A large section of Stat 101 was asked...Ch. 9 - Prob. 23ECh. 9 - Breakfast cereals We saw in Chapter 7 that the...Ch. 9 - Breakfast cereals again We saw a model in Exercise...Ch. 9 - Prob. 26ECh. 9 - Hand dexterity Researchers studied the dexterity...Ch. 9 - Candy bars with nuts The data on candy bars per...Ch. 9 - Scottish hill races, men and women The Scottish...Ch. 9 - Scottish hill races, men and women climbing The...
Knowledge Booster


Learn more about
Need a deep-dive on the concept behind this application? Look no further. Learn more about this topic, statistics and related others by exploring similar questions and additional content below.Similar questions
- Find the equation of the regression line for the following data set. x 1 2 3 y 0 3 4arrow_forwardFor the following exercises, consider the data in Table 5, which shows the percent of unemployed in a city ofpeople25 years or older who are college graduates is given below, by year. 41. Based on the set of data given in Table 7, calculatethe regression line using a calculator or othertechnology tool, and determine the correlationcoefficient to three decimal places.arrow_forwardFor the following exercises, consider the data in Table 5, which shows the percent of unemployed ina city of people 25 years or older who are college graduates is given below, by year. 40. Based on the set of data given in Table 6, calculate the regression line using a calculator or other technology tool, and determine the correlation coefficient to three decimal places.arrow_forward
- Respiratory Rate Researchers have found that the 95 th percentile the value at which 95% of the data are at or below for respiratory rates in breath per minute during the first 3 years of infancy are given by y=101.82411-0.0125995x+0.00013401x2 for awake infants and y=101.72858-0.0139928x+0.00017646x2 for sleeping infants, where x is the age in months. Source: Pediatrics. a. What is the domain for each function? b. For each respiratory rate, is the rate decreasing or increasing over the first 3 years of life? Hint: Is the graph of the quadratic in the exponent opening upward or downward? Where is the vertex? c. Verify your answer to part b using a graphing calculator. d. For a 1- year-old infant in the 95 th percentile, how much higher is the walking respiratory rate then the sleeping respiratory rate? e. f.arrow_forwardFor the following exercises, draw a best-fit line for the plotted data.arrow_forwardDemand for Candy Bars In this problem you will determine a linear demand equation that describes the demand for candy bars in your class. Survey your classmates to determine what price they would be willing to pay for a candy bar. Your survey form might look like the sample to the left. a Make a table of the number of respondents who answered yes at each price level. b Make a scatter plot of your data. c Find and graph the regression line y=mp+b, which gives the number of respondents y who would buy a candy bar if the price were p cents. This is the demand equation. Why is the slope m negative? d What is the p-intercept of the demand equation? What does this intercept tell you about pricing candy bars? Would you buy a candy bar from the vending machine in the hallway if the price is as indicated. Price Yes or No 50 75 1.00 1.25 1.50 1.75 2.00arrow_forward
arrow_back_ios
arrow_forward_ios
Recommended textbooks for you
 Glencoe Algebra 1, Student Edition, 9780079039897...AlgebraISBN:9780079039897Author:CarterPublisher:McGraw Hill
 Algebra and Trigonometry (MindTap Course List)AlgebraISBN:9781305071742Author:James Stewart, Lothar Redlin, Saleem WatsonPublisher:Cengage Learning
 Calculus For The Life SciencesCalculusISBN:9780321964038Author:GREENWELL, Raymond N., RITCHEY, Nathan P., Lial, Margaret L.Publisher:Pearson Addison Wesley,
 Algebra & Trigonometry with Analytic GeometryAlgebraISBN:9781133382119Author:SwokowskiPublisher:Cengage
Glencoe Algebra 1, Student Edition, 9780079039897...
Algebra
ISBN:9780079039897
Author:Carter
Publisher:McGraw Hill
Algebra and Trigonometry (MindTap Course List)
Algebra
ISBN:9781305071742
Author:James Stewart, Lothar Redlin, Saleem Watson
Publisher:Cengage Learning
Calculus For The Life Sciences
Calculus
ISBN:9780321964038
Author:GREENWELL, Raymond N., RITCHEY, Nathan P., Lial, Margaret L.
Publisher:Pearson Addison Wesley,
Algebra & Trigonometry with Analytic Geometry
Algebra
ISBN:9781133382119
Author:Swokowski
Publisher:Cengage
Correlation Vs Regression: Difference Between them with definition & Comparison Chart; Author: Key Differences;https://www.youtube.com/watch?v=Ou2QGSJVd0U;License: Standard YouTube License, CC-BY
Correlation and Regression: Concepts with Illustrative examples; Author: LEARN & APPLY : Lean and Six Sigma;https://www.youtube.com/watch?v=xTpHD5WLuoA;License: Standard YouTube License, CC-BY