Concept explainers
a.
To determine: The average
Risk and Return:
The risk and return are two closely related terms. The risk is the uncertainty attached to an event. In case of any investment, there is some amount of risk attached to it as there can be either gain or loss. While return in the financial term is that percentage which represents the profit in an investment.
Higher risk is associated with higher return and lower risk has a probability of lower return. The investor has to face a tradeoff between risk and return in terms of an investment.
Annual Rate of Return:
The annual rate of return refers to that return which is charged or is earned on an investment for a year. This rate is expressed in percentage.
a.
Answer to Problem 22SP

Explanation of Solution
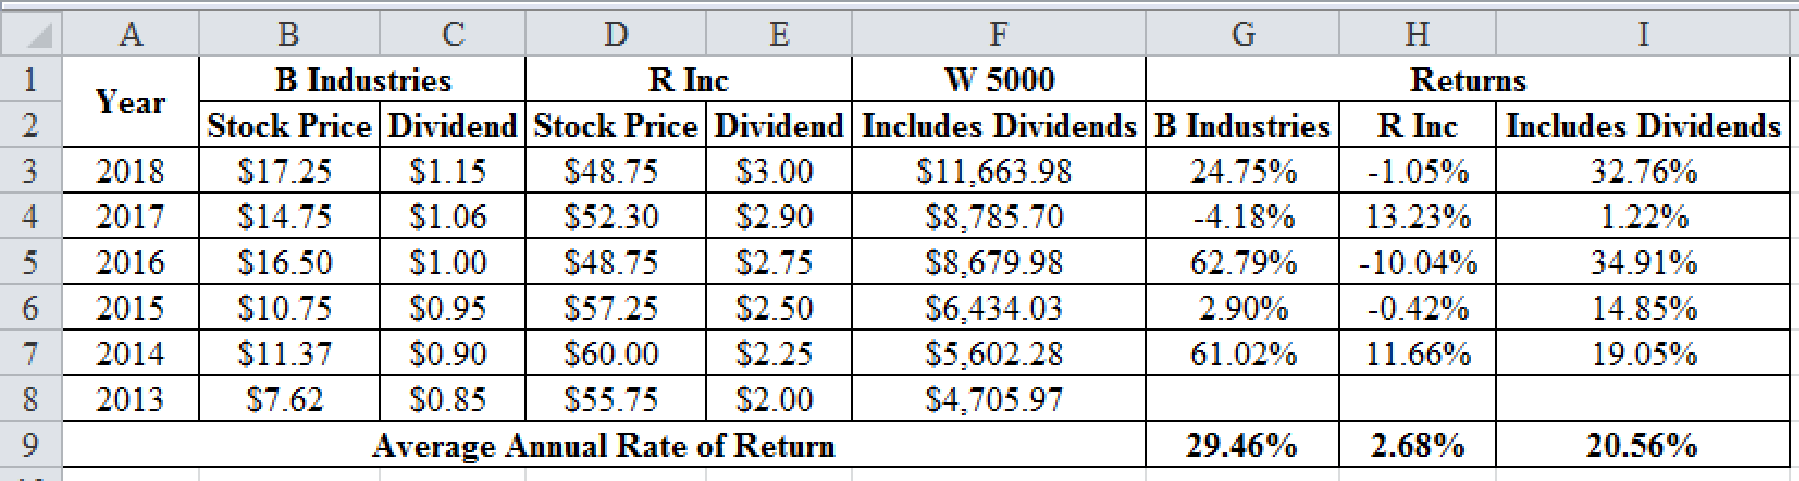
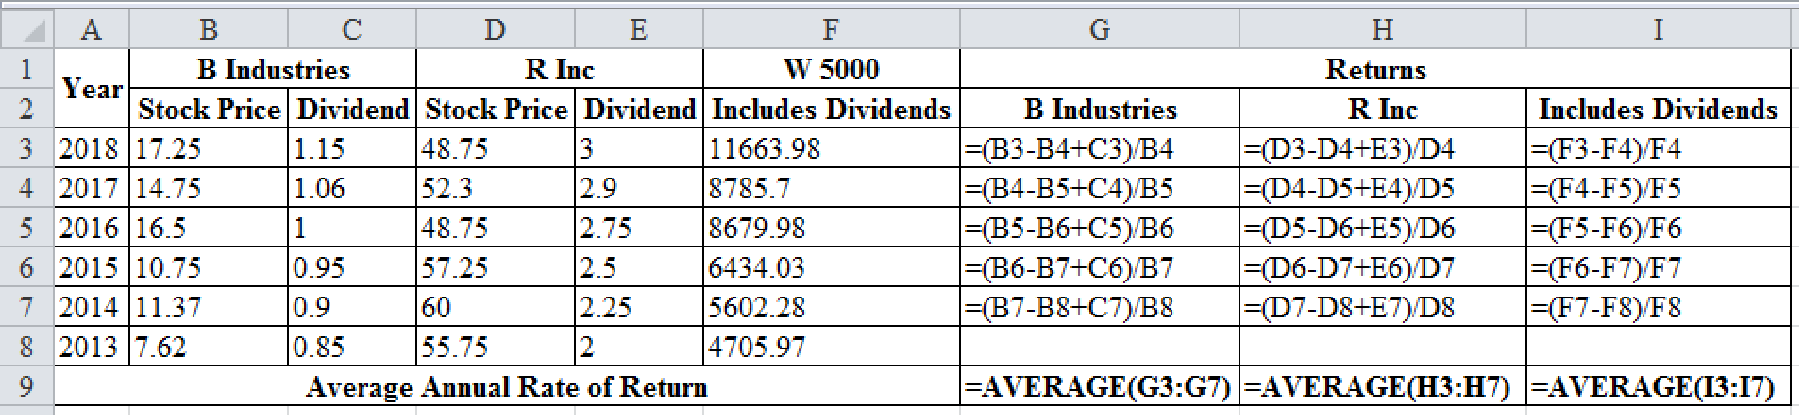
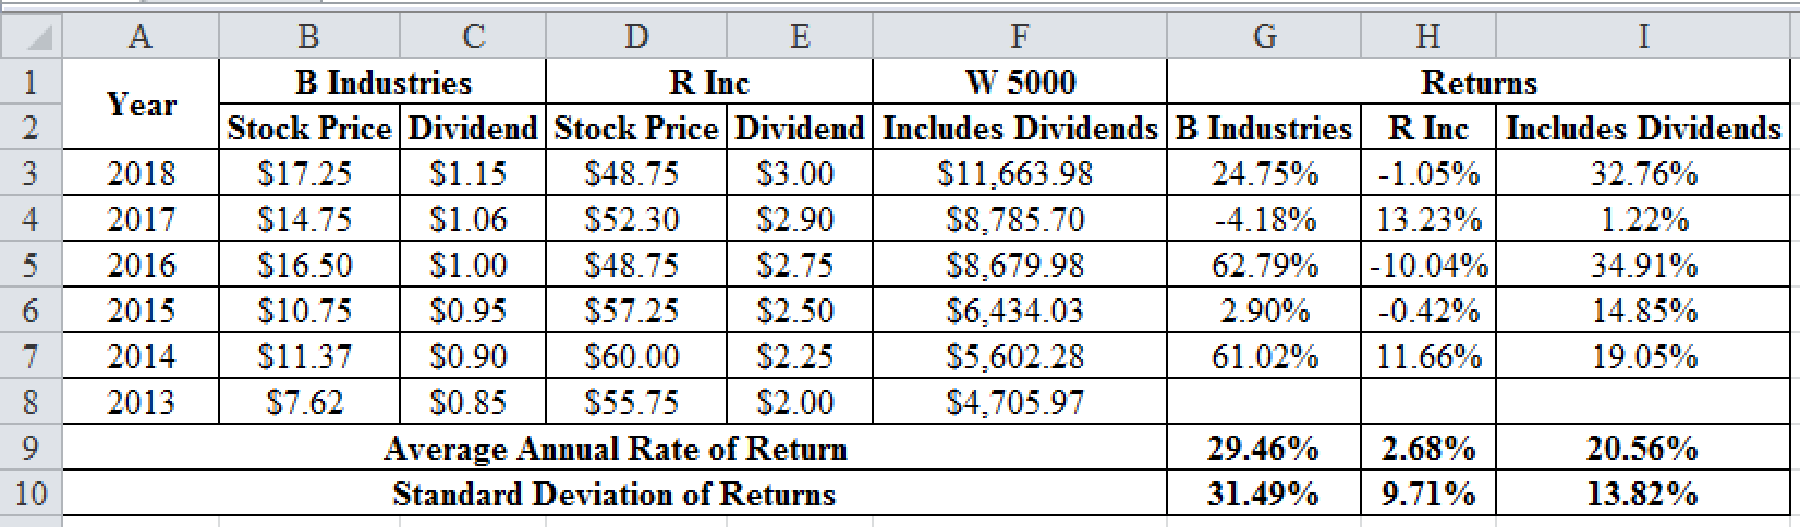
Calculation of annual rates of return in the excel spreadsheet:
Excel Spreadsheet:
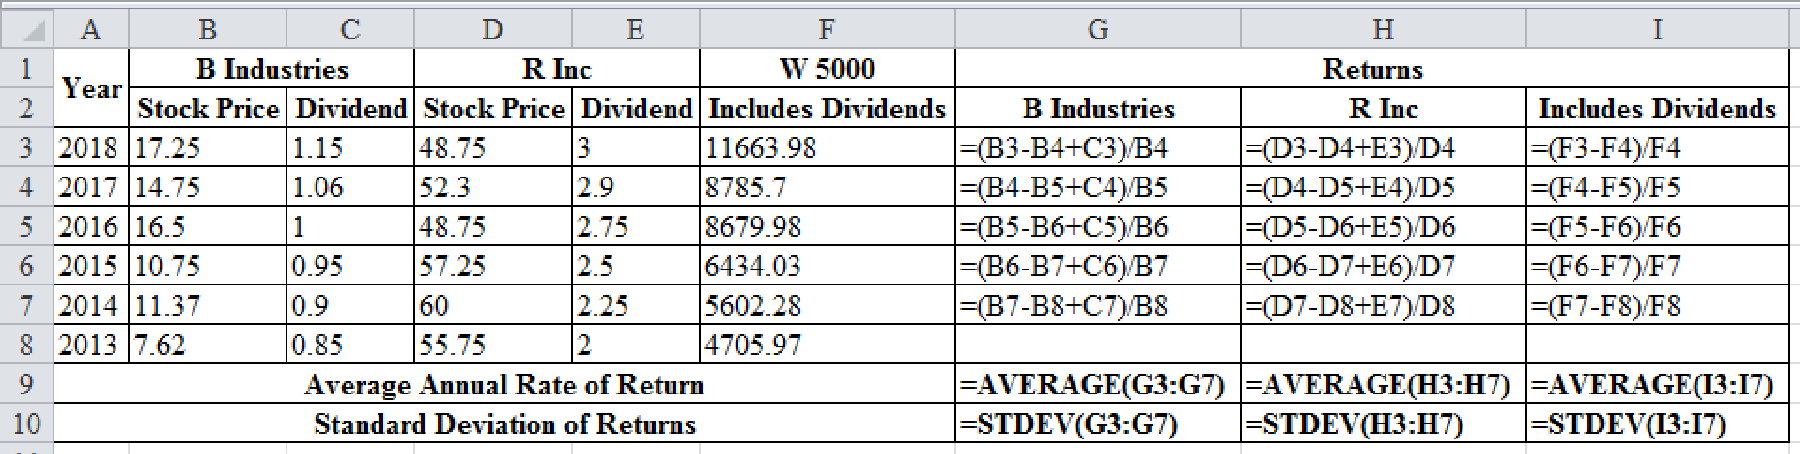
Excel Workings:
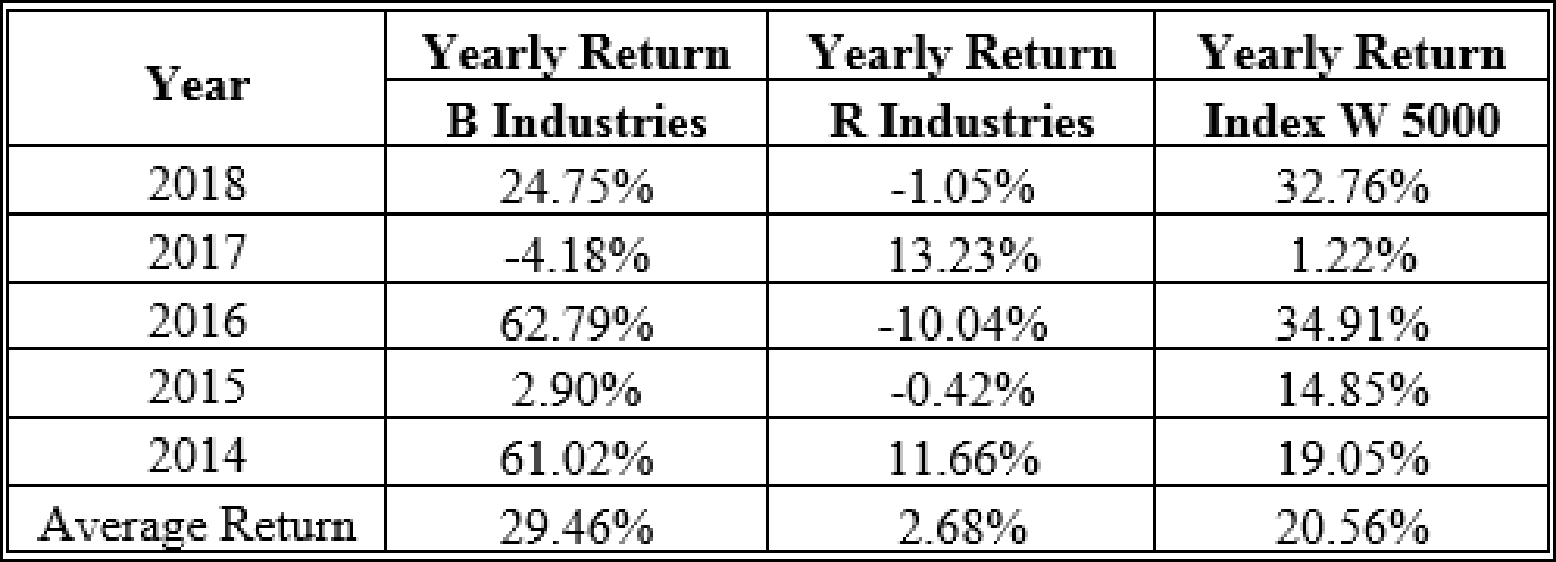
Therefore the yearly returns and average returns are as follows,
b.
To prepare: The standard deviation for the given data.
Standard deviation:
The standard deviation refers to the stand-alone risk associated with the securities. It measures how much a data is dispersed with its standard value. The Greek letter sigma represents the standard deviation.
b.
Answer to Problem 22SP
The standard deviation of B industries is 31.49%, R industries are 9.71% and Index W 5000 is 13.82%.
Explanation of Solution
Calculation of standard deviation with a excel spreadsheet:
Excel Spreadsheet:
Excel Workings:
Therefore the standard deviation of B industries is 31.49%, R industries are 9.71% and Index W 5000 is 13.82%.
c.
To determine: The coefficient of variation.
The coefficient of variation:
The coefficient of variation is a tool to determine the risk. It determines the risk per unit of return. It is used for measurement when the expected returns are same for two data.
c.
Answer to Problem 22SP
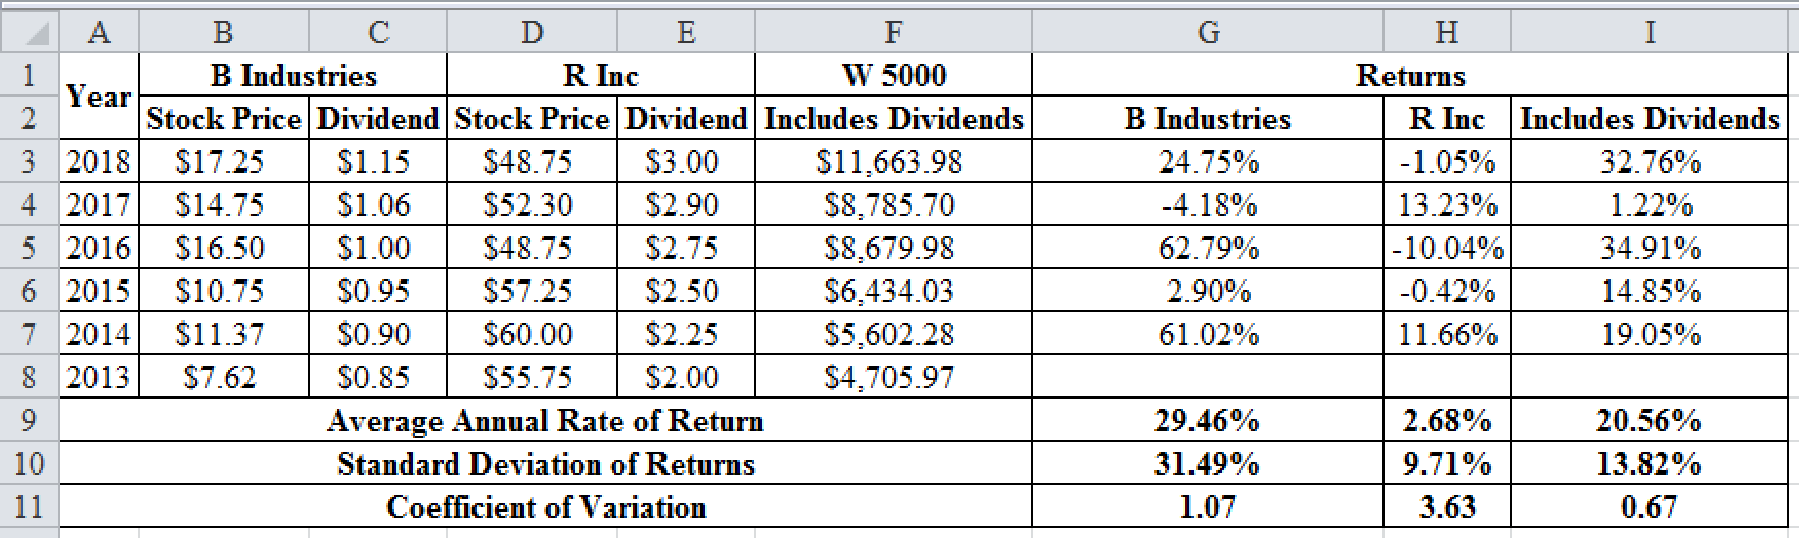
The coefficient of variation of B industries is 1.07, R industries are 3.63 and Index W 5000 is 0.67.
Explanation of Solution
The calculations of the coefficient of variation for the given data is shown below using excel:
Excel Spreadsheet:
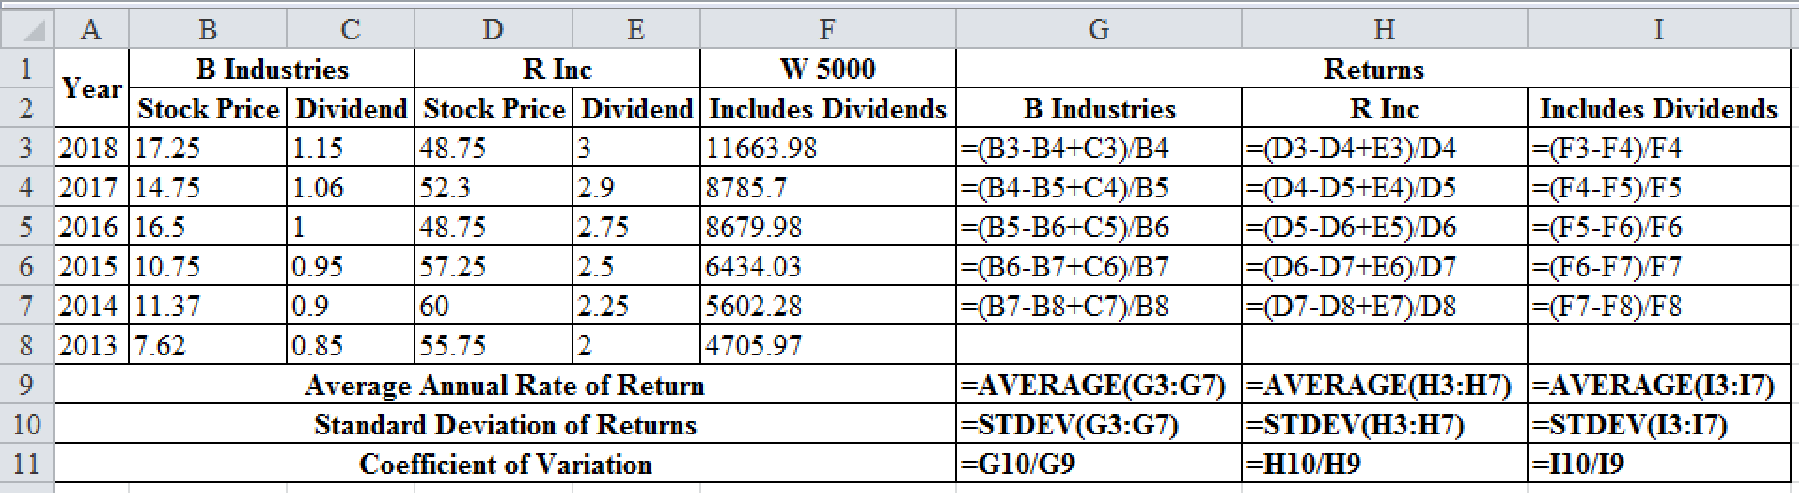
Excel Workings:
Therefore the coefficient of variation of B industries is 1.07, R industries are 3.63 and Index W 5000 is 0.67.
d.
To determine: The Sharpe ratio.
d.
Answer to Problem 22SP
The Sharpe ratio of B industries is 0.84, R industries are -0.03 and Index W 5000 is 1.27.
Explanation of Solution
Calculate the Sharpe Ratio for each company:
Therefore the Sharpe ratio of B industries is 0.84, R industries are -0.03 and Index W 5000 is 1.27.
e.
To prepare: A scatter diagram showing the company’s returns and the index returns.
e.
Explanation of Solution
The scatter diagram is as shown below:
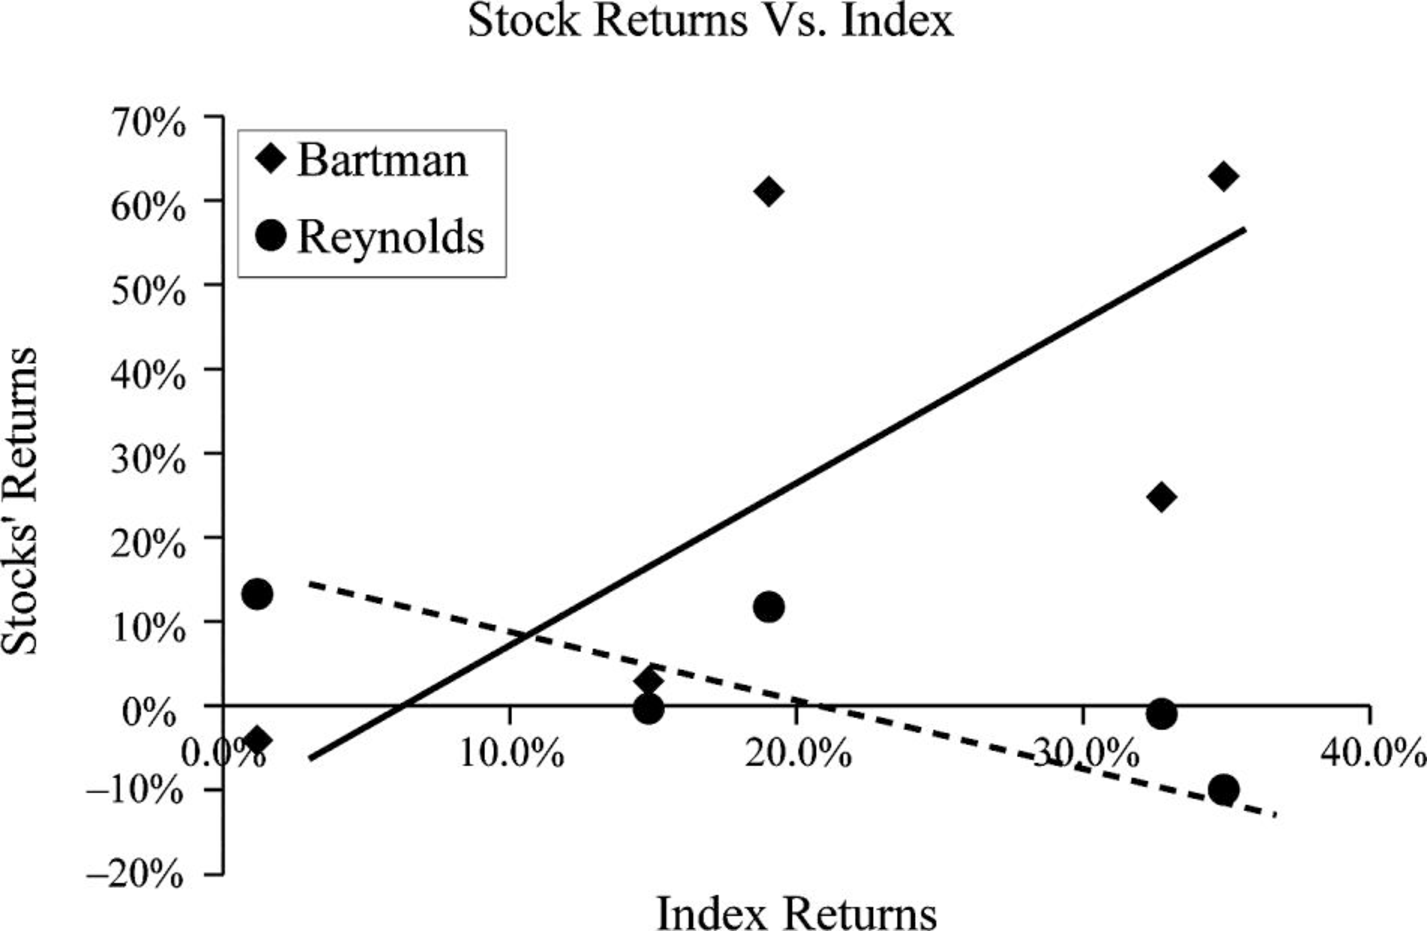
Graph (1)
- The blue line represents the B Industries and the red line represents the R Inc. and green lone represents the Index W 5000.
f.
To determine: The beta of the B Industries and R Inc. by running regressions of their returns.
f.
Answer to Problem 22SP
The beta of B industries is 1.53, R industries are -0.56.
Explanation of Solution
The beta of the B Industries, R Inc. and W 5000 by running regressions of their returns is:
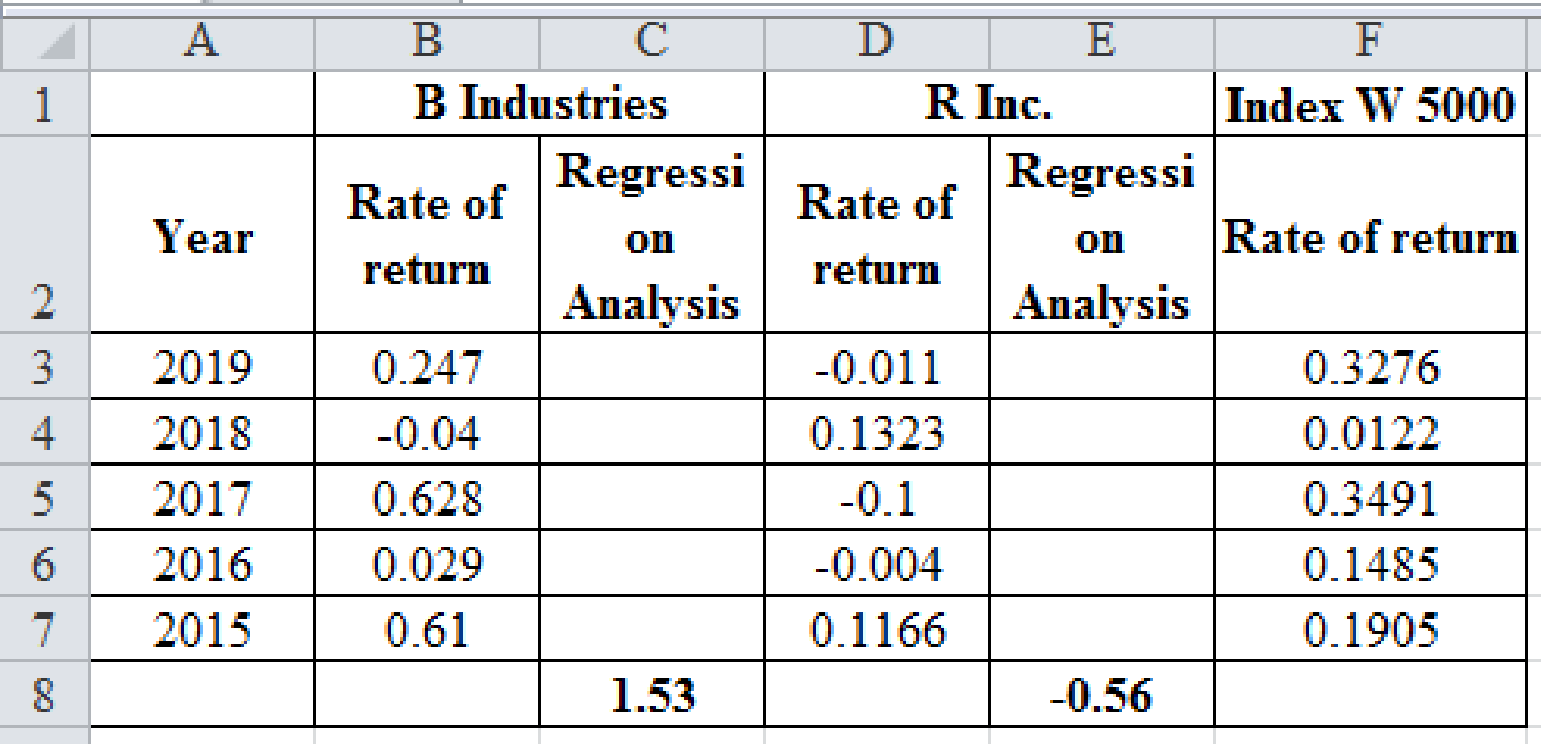
Therefore the beta of B industries is 1.53, R industries are -0.56.
g.
To determine: The required returns of the two companies by security market line equation.
g.
Answer to Problem 22SP
The required return of B industries is 13.67%, R industries are -3.26%.
Explanation of Solution
Given,
The risk-free rate is 4.5%.
The expected return on market is 10%.
Calculation of the required return:
Therefore the required return of B industries is 12.97%, R industries are 1.42%.
h.
To determine: The beta and the required return for a newly constructed portfolio.
h.
Answer to Problem 22SP
The required return of portfolio is 7.20% and the portfolio beta is 0.49.
Explanation of Solution
Calculation of the beta and the required return for the new portfolio:
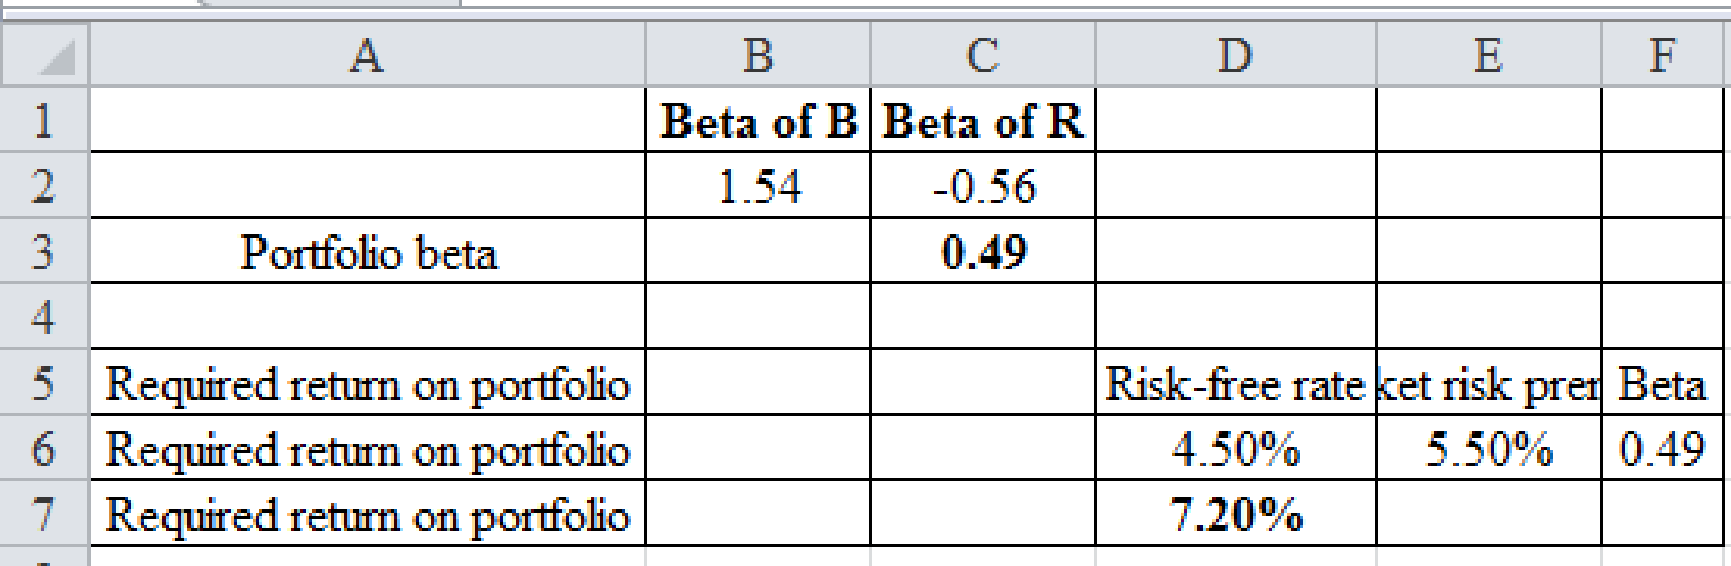
Therefore the required return of portfolio is 7.20% and the portfolio beta is 0.49.
i.
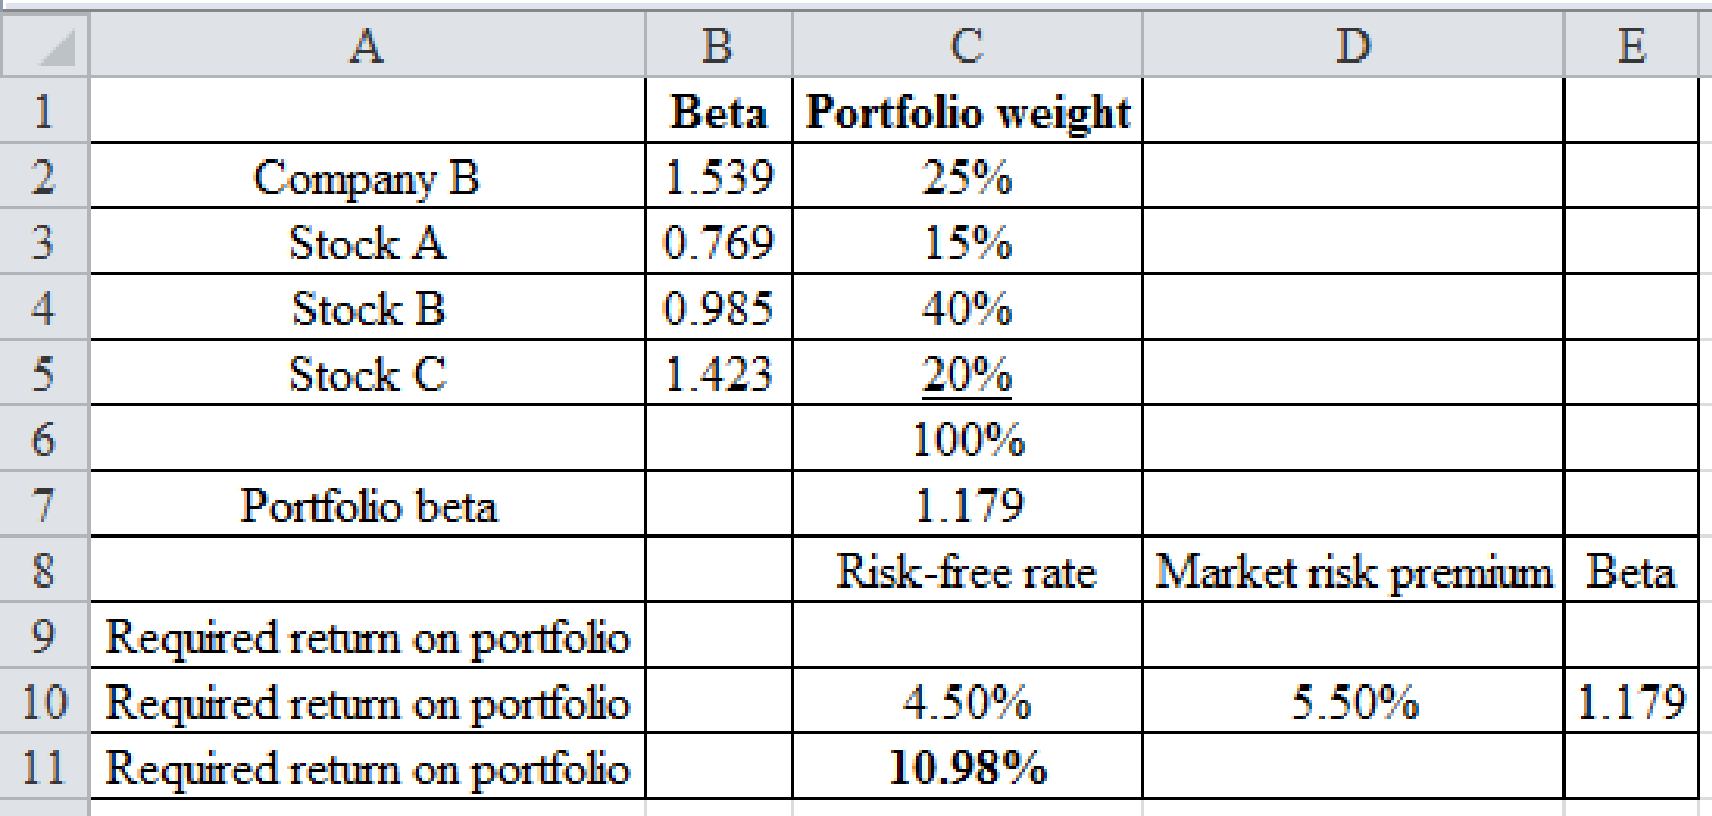
To determine: The new portfolio’s required return.
i.
Answer to Problem 22SP
The new portfolio’s required return is 10.98%.
Explanation of Solution
Calculation of the required return on the portfolio:
Excel Spreadsheet:
Excel Workings:
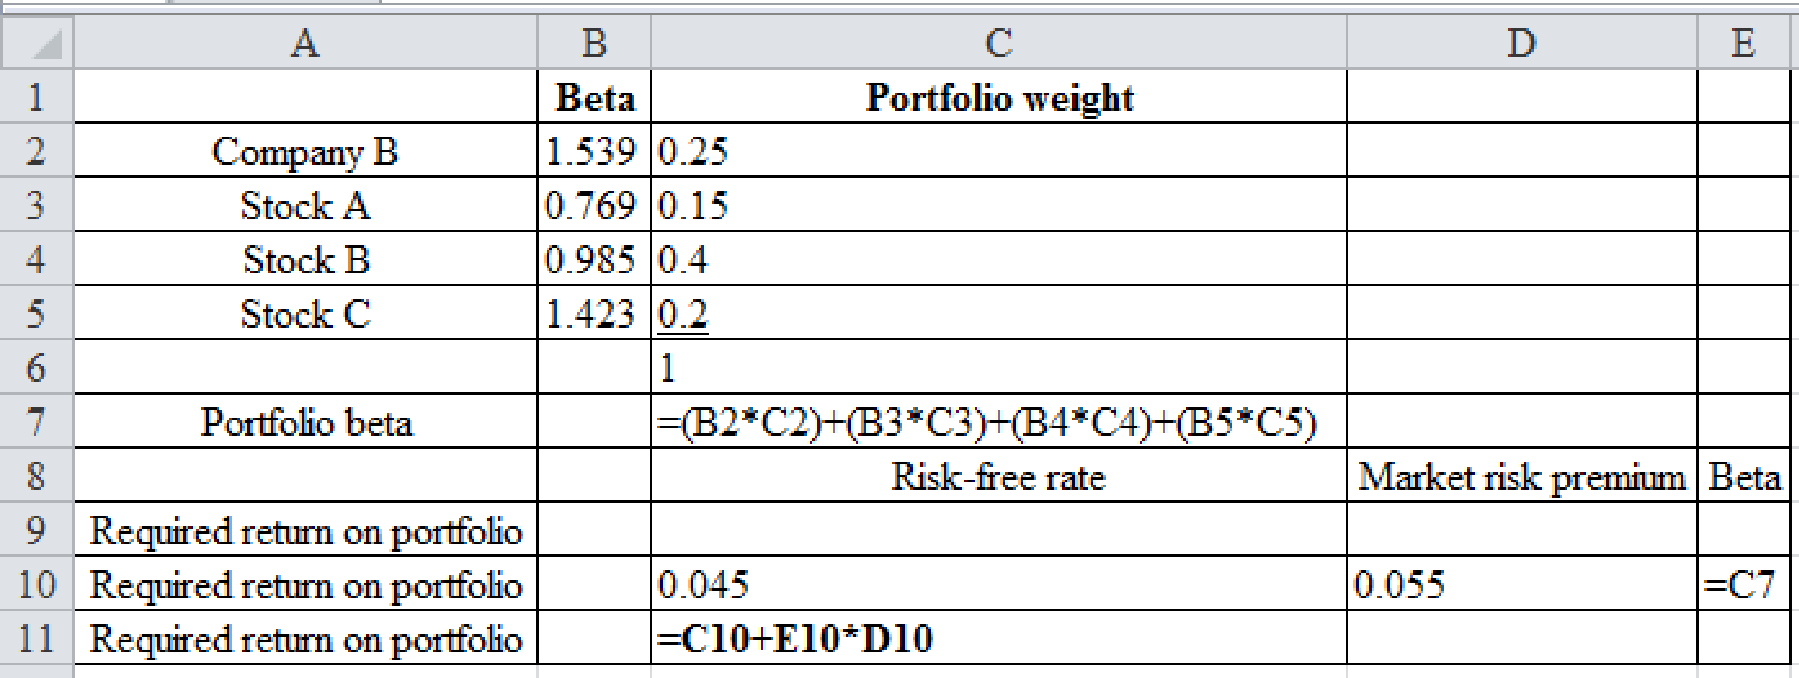
Therefore the new portfolio’s required return is 10.98%.
Want to see more full solutions like this?
Chapter 8 Solutions
Fundamentals Of Financial Management, Concise Edition (mindtap Course List)


- Use the extended DuPont equation to provide a breakdown of Computrons projected return on equity. How does the projection compare with the previous years and with the industrys DuPont equation?arrow_forward(Solving a comprehensive problem) Use the end-of-year stock price data in the popup window,, to answer the following questions for the Harris and Pinwheel companies. a. Compute the annual rates of return for each time period and for both firms. b. Calculate both the arithmetic and the geometric mean rates of return for the entire three-year period using your annual rates of return from part a. (Note: you may assume that neither firm pays any dividends.) c. Compute a three-year rate of return spanning the entire period (i.e., using the ending price for period 1 and ending price for period 4). d. Since the rate of return calculated in part c is a three-year rate of return, convert it to an annual rate of return by using the following equation: 1 + Three-Year Rate of Return 1 + Annual Rate of Return 3 e. How is the annual rate of return calculated in part d related to the geometric rate of return? When you are evaluating the performance of an investment that has been held for several…arrow_forwardReview the excerpted table of historic returns shown below. The returns have all been annualized after having calculated monthly returns for the previous ten years. In addition, information is provided about the average, the volatility, and the sensitivity of the possible investments. Time Period # Market Return Firm W Firm X Firm Y Firm Z T-Bill 1 0.333 0.191 0.218 0.955 0.601 0.035 2 -0.144 -0.423 -0.632 -0.747 -0.472 0.039 3 0.143 0.348 0.470 0.379 0.378 0.040 4 0.316 0.871 0.868 -0.192 0.502 0.036 5 0.178 0.912 0.499 0.694 0.364 0.036 6 -0.014 0.532 0.168 -0.671 -0.064 0.038 … … … … … … … … … … … … … … 119 0.374 0.556 1.014 0.023 0.698 0.037 120 0.173 0.547 0.092 0.658 0.222 0.036 Average Return 0.082 0.113 0.067 0.167 0.121 0.029 Standard…arrow_forward
- Review the excerpted table of historic returns shown below. The returns have all been annualized after having calculated monthly returns for the previous five years. In addition, information is provided about the average, the volatility, and the sensitivity of the possible investments. Time Period # Market Return Firm W Firm X Firm Y Firm Z T-Bill 1 0.333 0.191 0.218 0.955 0.601 0.035 2 -0.144 -0.423 -0.632 -0.747 -0.472 0.039 3 0.143 0.348 0.470 0.379 0.378 0.040 4 0.316 0.871 0.868 -0.192 0.502 0.036 5 0.178 0.912 0.499 0.694 0.364 0.036 6 -0.014 0.532 0.168 -0.671 -0.064 0.038 … … … … … … … … … … … … … … 59 0.374 0.556 1.014 0.023 0.698 0.037 60 0.173 0.547 0.092 0.658 0.222 0.036 Average Return 0.082 0.113 0.067 0.167 0.121 0.029 Standard…arrow_forwardAssume these are the stock market and Treasury bill returns for a 5-year period in the attached image: A. What was the risk premium on common stock in each year? (Do not round intermediate calculations. Enter your answers as a percent rounded to 2 decimal places.) Risk Premium 2013 % 2014 % 2015 % 2016 % 2017 % b. What was the average risk premium? (Do not round intermediate calculations. Enter your answer as a percent rounded to 2 decimal places.) c. What was the standard deviation of the risk premium? (Ignore that the estimation is from a sample of data.) (Do not round intermediate calculations. Enter your answer as a percent rounded to 2 decimal places.)arrow_forwardPresented here are summarized data from the balance sheets and income statements of Wiper Inc.: WIPER INC. Condensed Balance Sheets December 31, 2020, 2019, 2018 (in millions) 2020 $ 793 2,428 2019 $1,021 1,935 $2,956 2018 $ 883 1,734 $2,617 Current assets Other assets Total assets $3,221 Current liabilities Long-term liabilities Stockholders' equity $ 592 1,607 1,022 $3,221 $ 845 1,070 1,041 $2,956 $ 742 942 933 Total liabilities and stockholders' equity $2,617 WIPER INC. Selected Income Statement and Other Data For the year Ended December 31, 2020 and 2819 (in millions) 2020 2019 Income statement data: Sales $3,965 311 99 236 $2,928 325 Operating income Interest expense Net income Other data: Average number of common shares outstanding Total dividends paid 231 48.2 S 53.8 Required: a. Calculate return on investment, based on net income and average total assets, for 2020 and 2019. b. Calculate return on ecuity for 2020 and 2019. c. Calculate working capital and the current ratio for…arrow_forward
- Use the price and dividend information in the following table for stock ABC to answer the following questions. a) Assuming dividends are fully reinvested (at the ex-div stock price), what is the geometric average annual return for an investment in stock ABC from 26/4/2017 to 31/12/2020? Give your answer as a discrete annual rate. b) What is the IRR of an investment in stock ABC from 26/4/2017 to 31/12/2020 assuming you do not reinvest dividends? Give your answer as an annual continuously compounding rate. c) What is the IRR of an investment in stock ABC from 26/4/2017 to 31/12/2020 assuming you do not reinvest dividends and you liquidate half of your shareholding on 31/12/2019 at a stock price of $34.22? Give your answer as an annual continuously compounding rate. I need Quality solution. U will get up vote for quality answerarrow_forward1.) Given this return data, the average realized return on Blue Llama Mining Inc.’s stock is _______ . 2.) The preceding data series represents a sample of Blue Llama’s historical returns. Based on this conclusion, the standard deviation of Blue Llama’s historical returns is _______ . 3.) If investors expect the average realized return on Blue Llama Mining Inc.’s stock from 2016 to 2020 to continue into the future, its expected coefficient of variation (CV) is expected to equal _______ .arrow_forwardBartman Industries' and Reynolds Inc.'s stock prices and dividends, along with the Winslow 5000 Index, are shown here for the period 2015-2020. The Winslow 5000 data are adjusted to include dividends. Calculate the standard deviations of the returns for Bartman, Reynolds, and the Winslow 5000. (Hint: Use the sample standard deviation formula, STDEV function in Excel). Bartman Industries Reynolds Inc. Winslow 5000 Year Stock Price Dividend Holding period return Stock Price Dividend Holding period return Includes Divs. Holding period return 2020 $17.25 $1.15 $48.75 $3.00 11,663.98 2019 14.75 1.06 52.30 2.90 8,785.70 2018 16.50 1.00 48.75 2.75 8,679.98 2017 10.75 0.95 57.25 2.50 6,434.03 2016 11.37 0.90 60.00 2.25 5,602.28 2015 7.62 55.75 4,705.97arrow_forward
- PLEASE SOLVE THIS QUESTION, ASAP: Q: Suppose a company estimates following one year returns from investing in the common stock of Leopard Corporation: Possibility of Occurrence .1 .25 .1 .15 .1 .2 .1 Possible returns 15% 30% 15% -10% -5% 20% 10% Required: Calculate Expected return & Risk {Standard Deviation)arrow_forwardReturns earned over a given time period are called realized returns. Historical data on realized returns is often used to estimate future results. Analysts across companies use realized stock returns to estimate the risk of a stock. Five years of realized returns for Celestial Crane Cosmetics Inc. (Crane Cosmetics) are given in the following table: 2012 2013 2014 2015 2016 Stock return 23.75% 16.15% 28.50% 39.90% 12.35% Also note that: 1. While Crane Cosmetics was started 40 years ago, its common stock has been publicly traded for the past 25 years. 2. The returns on Crane Cosmetics's equity are calculated as arithmetic returns. Given this return data, the average realized return on Celestial Crane Cosmetics Inc.’s stock is . The preceding data series represents of Crane Cosmetics’s historical returns. Based on this conclusion, the standard deviation of Crane Cosmetics’s historical returns is . If investors expect the…arrow_forwardConsider the following table of annual rates of return, in percentage, for four common risky assets over the time period 2010 to 2019 • Berkshire Hathaway (ticker: BRK/A) • S&P 500 Index (ticker: SPX) • NASDAQ 100 Index (ticker: NDX) • Russell 2000 Index (ticker: RUT) YEAR BRK/A SPX NDX RUT 2010 21.4 15.1 19.22 26.85 2011 -4.7 2.1 2.7 -4.18 2012 16.8 16 16.82 16.35 2013 32.7 32.4 34.99 38.82 2014 27 13.7 17.94 4.89 2015 -12.5 1.4 8.43 -4.41 2016 23.4 12 5.89 21.31 2017 21.9 21.8 31.52 14.65 2018 2.8 -4.4 -1.04 -11.01 2019 11 31.5 37.96 25.52 Now assume there is a risk-free asset available and the annual risk-free rate is 2%. Using mean-variance portfolio theory, determine the 4 portfolio weightings and the portfolio variance for the unique fund F defined by the tangent portfolio and the one-fund theorem. Note that the portfolio weights sum to 1 and short selling (negative weights) are permissible.arrow_forward
 Fundamentals of Financial Management, Concise Edi...FinanceISBN:9781285065137Author:Eugene F. Brigham, Joel F. HoustonPublisher:Cengage Learning
 Fundamentals of Financial Management, Concise Edi...FinanceISBN:9781305635937Author:Eugene F. Brigham, Joel F. HoustonPublisher:Cengage Learning
 Fundamentals Of Financial Management, Concise Edi...FinanceISBN:9781337902571Author:Eugene F. Brigham, Joel F. HoustonPublisher:Cengage Learning
 Financial Reporting, Financial Statement Analysis...FinanceISBN:9781285190907Author:James M. Wahlen, Stephen P. Baginski, Mark BradshawPublisher:Cengage Learning