
Probability and Statistics for Engineering and the Sciences
9th Edition
ISBN: 9781305251809
Author: Jay L. Devore
Publisher: Cengage Learning
expand_more
expand_more
format_list_bulleted
Concept explainers
Videos
Textbook Question
Chapter 6.1, Problem 6E
Urinary angiotensinogen (AGT) level is one quantitative indicator of kidney
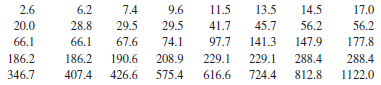
An appropriate probability plot supports the use of the lognormal distribution (see Section 4.5) as a reasonable model for urinary AGT level (this is what the investigators did).
- a. Estimate the parameters of the distribution. [Hint. Remember that X has a lognormal distribution with parameters μ and σ2 if ln(X) is
normally distributed withmean μ and variance σ2.] - b. Use the estimates of part (a) to calculate an estimate of the
expected value of AGT level. [Hint: What is E(X)?]
Expert Solution & Answer

Trending nowThis is a popular solution!

Students have asked these similar questions
Left ventricular mass (LVM) is an important risk factor for subsequent cardiovascular disease. A study is proposed to assess the relationship between childhood blood-pressure levels and LVM in children as determined from echocardiograms. The goal is to stratify children into a normal bp group (< 90th percentile for their age, gender, and height) and an elevated bp group (≥ 90th percentile for their age, gender, and height) and compare change in LVM between the two groups. Before this can be done, one needs to demonstrate that LVM actually changes in children over a 4-year period.
To help plan the main study, a pilot study is conducted where echocardiograms are obtained from 10 random children from the Bogalusa Heart Study at baseline and after 4 years of follow-up. The data are given in Table 1 .
Table 1 Pilot data on left ventricular mass (LVM) in children from the Bogalusa Heart Study
ID
Baseline LVM (g)
4- year LVM (g)
Change (g)*
1
139
163
24
2
134
126
-8
3
86
142
56…
Chapter 6 Solutions
Probability and Statistics for Engineering and the Sciences
Ch. 6.1 - The accompanying data on flexural strength (MPa)...Ch. 6.1 - The National Health and Nutrition Examination...Ch. 6.1 - Consider the following sample of observations on...Ch. 6.1 - The article from which the data in Exercise 1 was...Ch. 6.1 - As an example of a situation in which several...Ch. 6.1 - Urinary angiotensinogen (AGT) level is one...Ch. 6.1 - a. A random sample of 10 houses in a particular...Ch. 6.1 - In a random sample of 80 components of a certain...Ch. 6.1 - Each of 150 newly manufactured items is examined...Ch. 6.1 - Using a long rod that has length , you are going...
Ch. 6.1 - Of n1 randomly selected male smokers, X1 smoked...Ch. 6.1 - Suppose a certain type of fertilizer has an...Ch. 6.1 - Consider a random sample X1,..., Xn from the pdf...Ch. 6.1 - A sample of n captured Pandemonium jet fighters...Ch. 6.1 - Let X1, X2,..., Xn represent a random sample from...Ch. 6.1 - Suppose the true average growth of one type of...Ch. 6.1 - In Chapter 3, we defined a negative binomial rv as...Ch. 6.1 - Let X1, X2,..., Xn be a random sample from a pdf...Ch. 6.1 - An investigator wishes to estimate the proportion...Ch. 6.2 - A diagnostic test for a certain disease is applied...Ch. 6.2 - Let X have a Weibull distribution with parameters ...Ch. 6.2 - Let X denote the proportion of allotted time that...Ch. 6.2 - Let X represent the error in making a measurement...Ch. 6.2 - A vehicle with a particular defect in its emission...Ch. 6.2 - The shear strength of each of ten test spot welds...Ch. 6.2 - Consider randomly selecting n segments of pipe and...Ch. 6.2 - Let X1,..., Xn be a random sample from a gamma...Ch. 6.2 - Prob. 28ECh. 6.2 - Consider a random sample X1, X2,, Xn from the...Ch. 6.2 - At time t = 0, 20 identical components are tested....Ch. 6 - An estimator is said to be consistent if for any ...Ch. 6 - a. Let X1,.., Xn be a random sample from a uniform...Ch. 6 - At time t = 0, there is one individual alive in a...Ch. 6 - The mean squared error of an estimator is MSE ()...Ch. 6 - Prob. 35SECh. 6 - When the population distribution is normal, the...Ch. 6 - When the sample standard deviation S is based on a...Ch. 6 - Each of n specimens is to be weighed twice on the...
Knowledge Booster


Learn more about
Need a deep-dive on the concept behind this application? Look no further. Learn more about this topic, statistics and related others by exploring similar questions and additional content below.Similar questions
- The table below is from a study called “The Epidemiology of Social Stress.” The researchers in this study conduct a series of statistical tests to shed light on the association between social status variables (IVs) and depression (DVs). The left-hand column shows the tests for mean depressive symptom scores (Number of symptoms reported [range:0-50], higher levels indicate higher number of reported depressive symptoms) by sex, age, marital status, and occupational prestige. The right-hand column shows the tests for prevalence of major depressive disorder (has major depression=1; does not have major depression=0), broken down by sex, age, marital status, and occupational prestige. Examine the table and answer questions a)At alpha=.05, what can you conclude about the association between marital status and mean depressive symptom scores? Briefly summarize the findings, and provide a plausible, logical explanation (theory) for the observed association (or lack thereof). b)At alpha =.001,…arrow_forwardLeft ventricular mass (LVM) is an important risk factor for subsequent cardiovascular disease. A study is proposed to assess the relationship between childhood blood-pressure levels and LVM in children as determined from echocardiograms. The goal is to stratify children into a normal bp group (< 80th percentile for their age, gender, and height) and an elevated bp group (≥ 90th percentile for their age, gender, and height) and compare change in LVM between the two groups. Before this can be done, one needs to demonstrate that LVM actually changes in children over a 4-year period. To help plan the main study, a pilot study is conducted where echocardiograms are obtained from 10 random children from the Bogalusa Heart Study at baseline and after 4 years of follow-up. The data are given in Table 9.18 (Note: These are the same data as in Table 8.27, p. 329). 9.68 What is the critical region at the 5% level? (i.e., for what values of the test statistic will we reject H0 at the 5% level?)…arrow_forwardLeft ventricular mass (LVM) is an important risk factor for subsequent cardiovascular disease. A study is proposed to assess the relationship between childhood blood-pressure levels and LVM in children as determined from echocardiograms. The goal is to stratify children into a normal bp group (< 80th percentile for their age, gender, and height) and an elevated bp group (≥ 90th percentile for their age, gender, and height) and compare change in LVM between the two groups. Before this can be done, one needs to demonstrate that LVM actually changes in children over a 4-year period. To help plan the main study, a pilot study is conducted where echocardiograms are obtained from 10 random children from the Bogalusa Heart Study at baseline and after 4 years of follow-up. The data are given in Table 9.18 (Note: These are the same data as in Table 8.27, p. 329). 9.71 Compare your results in Problems 9.69 and 9.70. 9.72 Compare your results to those obtained using t test methods in Problem…arrow_forward
- Left ventricular mass (LVM) is an important risk factor for subsequent cardiovascular disease. A study is proposed to assess the relationship between childhood blood-pressure levels and LVM in children as determined from echocardiograms. The goal is to stratify children into a normal bp group (< 80th percentile for their age, gender, and height) and an elevated bp group (≥ 90th percentile for their age, gender, and height) and compare change in LVM between the two groups. Before this can be done, one needs to demonstrate that LVM actually changes in children over a 4-year period. To help plan the main study, a pilot study is conducted where echocardiograms are obtained from 10 random children from the Bogalusa Heart Study at baseline and after 4 years of follow-up. The data are given in Table 9.18 (Note: These are the same data as in Table 8.27, p. 329). 9.65 Suppose the investigators are reluctant to assume that the change in LVM over four years is normally distributed. What test…arrow_forwardLeft ventricular mass (LVM) is an important risk factor for subsequent cardiovascular disease. A study is proposed to assess the relationship between childhood blood-pressure levels and LVM in children as determined from echocardiograms. The goal is to stratify children into a normal bp group (< 80th percentile for their age, gender, and height)and an elevated bp group (≥ 90th percentile for their age, gender, and height) and compare change in LVM between the two groups. Before this can be done, one needs to demonstrate that LVM actually changes in children over a 4-year period. To help plan the main study, a pilot study is conducted where echocardiograms are obtained from 10 random children from the Bogalusa Heart Study at baseline and after4 years of follow-up. The data are given in images. a) Suppose the investigators are reluctant to assume that the change in LVM over four years is normally distributed. What test can be used to assess if there is a change in mean LVM over four…arrow_forwardLeft ventricular mass (LVM) is an important risk factor for subsequent cardiovascular disease. A study is proposed to assess the relationship between childhood blood-pressure levels and LVM in children as determined from echocardiograms. The goal is to stratify children into a normal bp group (< 80th percentile for their age, gender, and height) and an elevated bp group (≥ 90th percentile for their age, gender, and height) and compare change in LVM between the two groups. Before this can be done, one needs to demonstrate that LVM actually changes in children over a 4-year period.To help plan the main study, a pilot study is conducted where echocardiograms are obtained from 10 random children from the Bogalusa Heart Study at baseline and after 4 years of follow-up. The data are given in Table 9.18. A)Suppose the investigators are reluctant to assume that the change in LVM over four years is normally distributed. What test can be used to assess if there is a change in mean LVM over…arrow_forward
- Left ventricular mass (LVM) is an important risk factor for subsequent cardiovascular disease. A study is proposed to assess the relationship between childhood blood-pressure levels and LVM in children as determined from echocardiograms. The goal is to stratify children into a normal bp group (< 80th percentile for their age, gender, and height)and an elevated bp group (≥ 90th percentile for their age, gender, and height) and compare change in LVM between the two groups. Before this can be done, one needs to demonstrate that LVM actually changes in children over a 4-year period. To help plan the main study, a pilot study is conducted where echocardiograms are obtained from 10 random children from the Bogalusa Heart Study at baseline and after4 years of follow-up. The data are given in images. Problem a)What is the two-sided p-value for this test?Problem b)Now perform the test using the exact method andobtain a 2-sided p-value.Problem c) Compare your results in Problems a and b.arrow_forwardPassive exposure to environmental tobacco smoke has been associated with growth suppression and an increased frequency of respiratory tract infections in normal children. Is this association more pronounced in children with cystic fibrosis? To answer this question, 43 children (18 girls and 25 boys) attending a 2-week summer camp for cystic fibrosis patients were studied (New England Journal of Medicine, Sept. 20, 1990). Among several variables measured were the child's weight percentile (y) and the number of cigarettes smoked per day in the child's home (x). a. For the 18 girls, the coefficient of correlation between y and x was reported as r = –.50. Interpret - this result. b. Refer to part a. The p-value for testing Ho: p = 0 against H;: p # 0 was reported as p = .03. n Interpret this result. c. For the 25 boys, the coefficient of correlation between y and x was reported asr = -.12. Interpret %3D %3D this result. d. Refer to part c. The p-value for testing Ho: p = 0 against Ha: p #…arrow_forwardAnkle Brachial Index. The ankle brachial index (ABI) compares the blood pressure of a patient’s arm to the blood pressure of the patient’s leg. The ABI can be an indicator of different diseases, including arterial diseases. A healthy (or normal) ABI is 0.9 or greater. In a study by M. McDermott et al. titled “Sex Differences in Peripheral Arterial Disease: Leg Symptoms and Physical Functioning” (Journal of the American Geriatrics Society, Vol. 51, No. 2, pp. 222–228), the researchers obtained the ABI of 187 women with peripheral arterial disease. The results were a mean ABI of 0.64 with a standard deviation of 0.15. At the 1% significance level, do the data provide sufficient evidence to conclude that, on average, women with peripheral arterial disease have an unhealthy ABI?arrow_forward
- Blood cocaine concentration (mg/L) was determinedboth for a sample of individuals who had died fromcocaine-induced excited delirium (ED) and for a sampleof those who had died from a cocaine overdose withoutexcited delirium; survival time for people in bothgroups was at most 6 hours. The accompanying datawas read from a comparative boxplot in the article“Fatal Excited Delirium Following Cocaine Use” (J.of Forensic Sciences, 1997: 25–31). ED 0 0 0 0 .1 .1 .1 .1 .2 .2 .3 .3.3 .4 .5 .7 .8 1.0 1.5 2.7 2.83.5 4.0 8.9 9.2 11.7 21.0Non-ED 0 0 0 0 0 .1 .1 .1 .1 .2 .2 .2.3 .3 .3 .4 .5 .5 .6 .8 .9 1.01.2 1.4 1.5 1.7 2.0 3.2 3.5 4.14.3 4.8 5.0 5.6 5.9 6.0 6.4 7.98.3 8.7 9.1 9.6 9.9 11.0 11.512.2 12.7 14.0 16.6 17.8 a. Determine the medians, fourths, and fourth spreadsfor the two samples.b. Are there any outliers in either sample? Any extremeoutliers?c. Construct a comparative boxplot, and use it as abasis for comparing and contrasting the ED andnon-ED samples.arrow_forwardThe table below refers to a case control study on the association between sulfones and streptomycin drugs in the treatment of leprosy. Subjects were sampled based on their clinical change to treatment and then asked whether they had a high or low degree of infiltration. The degree of infiltration measures a type of skin damage. We will use clinical change response scores {-1, 0, 1, 2, 3}. The question of interest is whether degree of infiltration is associated with clinical change. (a) Compute the sample proportions of having a high degree of infiltration for each clinical change group? What type of variable is Clinical Change? (B)Conduct a Cochran-Armitage trend test at the 5% significance level to determine whether there is an association between degree of infiltration and clinical change. (C)Now, ignore the fact that clinical change is an ordinal variable. Conduct a chi-squared test for association between degree of infiltration and clinical change at the 5% significance…arrow_forwardAn article in Plant Disease, "Effect of Nitrogen and Potassium Fertilizer Rates on Severity of Xanthomonas Blight of Syngonium Podophyllum" (1989, Vol. 73, No. 12, pp. 972-975) showed the effect of the variable nitrogen and potassium rates on the growth of "White Butterfly" and the mean percentage of disease. Data representative of that collected in this experiment is provided in the following table. Potassium (mg/pot/wk) Nitrogen (mg/pot/wk) 30 90 120 50 60.8 60.8 45.5 43.0 60.0 58.4 150 54.4 56.1 53.8 51.6 34.5 35.5 250 42.9 40.0 36.1 37.9 33.0 33.3 (a) Use the analysis of variance to test the appropriate hypotheses with a = 0.05. The effect of the variable nitrogen significant, the effect of the potassium rates significant, the interaction between the variable nitrogen and potassium rates significant. (b) Graphically analyze the residuals from this experiment. The residuals acceptable. (c) Estimate the appropriate variance component. Round your answers to 2 decimal places. Source…arrow_forward
arrow_back_ios
SEE MORE QUESTIONS
arrow_forward_ios
Recommended textbooks for you
 Calculus For The Life SciencesCalculusISBN:9780321964038Author:GREENWELL, Raymond N., RITCHEY, Nathan P., Lial, Margaret L.Publisher:Pearson Addison Wesley,
 Big Ideas Math A Bridge To Success Algebra 1: Stu...AlgebraISBN:9781680331141Author:HOUGHTON MIFFLIN HARCOURTPublisher:Houghton Mifflin Harcourt
 Glencoe Algebra 1, Student Edition, 9780079039897...AlgebraISBN:9780079039897Author:CarterPublisher:McGraw Hill
Calculus For The Life Sciences
Calculus
ISBN:9780321964038
Author:GREENWELL, Raymond N., RITCHEY, Nathan P., Lial, Margaret L.
Publisher:Pearson Addison Wesley,
Big Ideas Math A Bridge To Success Algebra 1: Stu...
Algebra
ISBN:9781680331141
Author:HOUGHTON MIFFLIN HARCOURT
Publisher:Houghton Mifflin Harcourt
Glencoe Algebra 1, Student Edition, 9780079039897...
Algebra
ISBN:9780079039897
Author:Carter
Publisher:McGraw Hill
Mod-01 Lec-01 Discrete probability distributions (Part 1); Author: nptelhrd;https://www.youtube.com/watch?v=6x1pL9Yov1k;License: Standard YouTube License, CC-BY
Discrete Probability Distributions; Author: Learn Something;https://www.youtube.com/watch?v=m9U4UelWLFs;License: Standard YouTube License, CC-BY
Probability Distribution Functions (PMF, PDF, CDF); Author: zedstatistics;https://www.youtube.com/watch?v=YXLVjCKVP7U;License: Standard YouTube License, CC-BY
Discrete Distributions: Binomial, Poisson and Hypergeometric | Statistics for Data Science; Author: Dr. Bharatendra Rai;https://www.youtube.com/watch?v=lHhyy4JMigg;License: Standard Youtube License