
Videos
To sketch:The graph of the function and describe the domain and range.
Answer to Problem 36E
The graph of the given function is drawn in blue color in the following graph:

The domain is all real numbers and the range is
Explanation of Solution
Giveninformation:
The function is
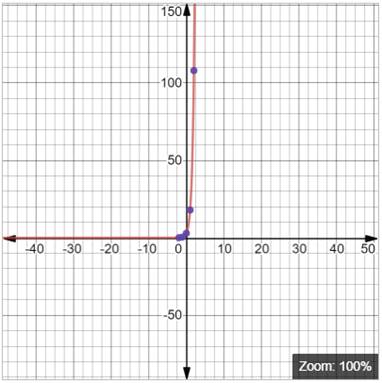
To graph the function, let’s begin by graphing
| 0 | 1 | 2 | |||
| 0.083 | 0.5 | 3 | 18 | 108 |
Now, plotting the ordered points and drawing a smooth curve through the points, we obtain:
Now, shift the graph by 1units to the right and shift it 5 units down to obtain the graph of the given function. That is,
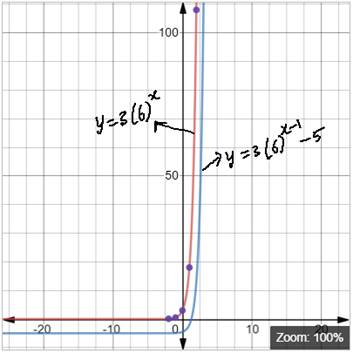
Conclusion:
From the graph, we can observe that the graph of the function approaches the line
Chapter 6 Solutions
BIG IDEAS MATH Integrated Math 1: Student Edition 2016


 Discrete Mathematics and Its Applications ( 8th I...MathISBN:9781259676512Author:Kenneth H RosenPublisher:McGraw-Hill Education
 Mathematics for Elementary Teachers with Activiti...MathISBN:9780134392790Author:Beckmann, SybillaPublisher:PEARSON
 Thinking Mathematically (7th Edition)MathISBN:9780134683713Author:Robert F. BlitzerPublisher:PEARSON
 Discrete Mathematics With ApplicationsMathISBN:9781337694193Author:EPP, Susanna S.Publisher:Cengage Learning,
 Pathways To Math Literacy (looseleaf)MathISBN:9781259985607Author:David Sobecki Professor, Brian A. MercerPublisher:McGraw-Hill Education