Interpretation: The graph between the density and the
Concept Introduction: To plot a graph between two variables, the data given for one can be plotted at the x -axis and the other at the y -axis. The trend can be explained based on the shape of the graph obtained.
The given data for atomic number and density of the element is as follows:
| Element | Atomic number | Density |
| Nitrogen | 7 | |
| Phosphorus | 15 | 1.82 |
| Arsenic | 33 | 5.22 |
| Antimony | 51 | 6.53 |
| Bismuth | 83 | 10.05 |
The graph can be plotted as follows:
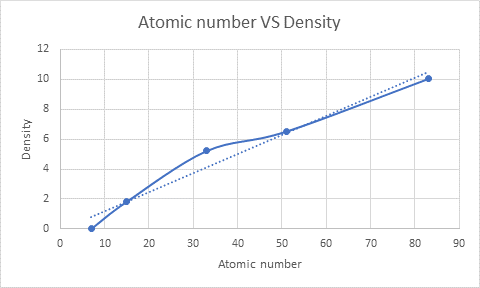
On moving from top to bottom in a group, atomic number increases and atomic radius also increases (as the new shell is added around the nucleus). Due to an increase in atomic radius, density also increases. This can also be confirmed from the plot obtained between the atomic number and density of the element. Here, Nitrogen with the lowest atomic number has the lowest density, and bismuth with the highest atomic number has the highest density.
Therefore, the trend is the density of an element increases with increasing atomic number.
Chapter 6 Solutions
Glencoe Chemistry: Matter and Change, Student Edition

 ChemistryChemistryISBN:9781305957404Author:Steven S. Zumdahl, Susan A. Zumdahl, Donald J. DeCostePublisher:Cengage Learning
 ChemistryChemistryISBN:9781259911156Author:Raymond Chang Dr., Jason Overby ProfessorPublisher:McGraw-Hill Education
 Principles of Instrumental AnalysisChemistryISBN:9781305577213Author:Douglas A. Skoog, F. James Holler, Stanley R. CrouchPublisher:Cengage Learning
 Organic ChemistryChemistryISBN:9780078021558Author:Janice Gorzynski Smith Dr.Publisher:McGraw-Hill Education
 Chemistry: Principles and ReactionsChemistryISBN:9781305079373Author:William L. Masterton, Cecile N. HurleyPublisher:Cengage Learning
 Elementary Principles of Chemical Processes, Bind...ChemistryISBN:9781118431221Author:Richard M. Felder, Ronald W. Rousseau, Lisa G. BullardPublisher:WILEY