
Concept explainers
Videos
Self-Concept and Sightedness. Self-concept can be defined as the general view of oneself in terms of personal value and capabilities. A study of whether visual impairment affects self-concept was reported in the article ‘‘An Exploration into Self Concept: A Comparative Analysis between the Adolescents Who Are Sighted and Blind in India’’ (British Journal of Visual Impairment, Vol. 30, No. 1, pp. 31–41) by S. Halder and P. Datta. The following
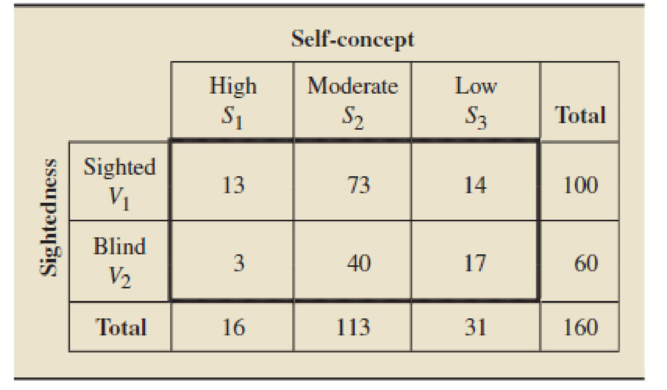
- a. Find P(V2).
- b. Find P(V2 & S3).
- c. Obtain P(S3 | V2) directly from the table.
- d. Obtain P(S3 | V2) by using the conditional probability rule and your answers from parts (a) and (b).
Want to see the full answer?
Check out a sample textbook solution
Chapter 4 Solutions
Introductory Statistics (10th Edition)
Additional Math Textbook Solutions
Elementary Statistics
Essentials of Statistics (6th Edition)
Elementary Statistics: Picturing the World (7th Edition)
Business Analytics
Introduction to Statistical Quality Control
Elementary Statistics (Text Only)


- Provide an illustration on how Bayesian analysis is used.arrow_forwardThe paper "From Dr. Kildare to Grey's Anatomy"† describes several studies of how the way in which doctors are portrayed on television might influence public perception of doctors. One study was described as follows. Rebecca Chory, Ph.D., now an associate professor of communication at West Virginia University, began studying the effect of such portrayals on patients' attitudes toward physicians. Using a survey of 300 undergraduate students, she compared perceptions of physicians in 1992—the end of the era when physicians were shown as all-knowing, wise father figures—with those in 1999, when shows such as ER and Chicago Hope (1994–2000) were continuing the transformation to showing the private side and lives of physicians, including vivid demonstrations of their weaknesses and insecurities. Dr. Chory found that, regardless of the respondents' personal experience with physicians, those who watched certain kinds of television had declining perceptions of physicians' composure and regard…arrow_forwardidentify the independent variable, the dependant variable and the unit of analysis of the following statement Whitfield, D.L., Kattari, S.K., Langenderfer-Magruder, L., Walls, E.N. and Ramos, D.A. (2019). The crossroads of identities: Predictors of harassment among lesbian, gay, bisexual, and queer adults. Journal of the Society for Social Work and Research, 10(2): 237-260. Independent variable(s)______________________________________________________ Dependent variable(s)_______________________________________________________ Unit of analysis_______________________________________________________arrow_forward
- The article "Vehicle-Arrival Characteristics at Urban Uncontrolled Intersections" (V. Rengaraju and V. Rao, Journal of Transportation Engineering, 1995: 317-323) presents data on traffic characteristics at 10 intersections in Madras, India. One characteristic measured was the speeds of the vehicles traveling through the intersections. The accompanying table gives the 15th, 50th, and 85th percentiles of speed (in km/h) for two intersections. Percentile Intersection 15th 50th 85th 27.5 37.5 40.0 в 24.5 26.5 36.0 If a histogram for speeds of vehicles through intersection A were drawn, would it most likely be skewed to the left, skewed to the right, or approximately symmetric? Explain. b. If a histogram for speeds of vehicles through intersection B were drawn, would it most likely be skewed to the left, skewed to the right, or approximately symmetric? Explain. a.arrow_forwardWhat is the study being created here?arrow_forwardA study of the relationship between blood pressure and cholesterol level showed the following results for people who took part in the study: (a) of those who had high blood pressure, 50% had a high cholesterol level, and (b) of those who had high cholesterol level, 80% had high blood pressure. Of those in the study who had at least one of the conditions of high blood pressure or high cholesterol level, what is the proportion who had both conditions? A) B) o} D)를 Barrow_forward
- What condition on a data set is required to apply the empirical rule?arrow_forwardA research team is interested in determining if there is a relationship between death anxiety and religiosity. Subjects completed a death anxiety scale (high score = high anxiety) and also completed a checklist designed to measure an individual's degree of religiosity (belief in a particular religion, regular attendance at religious services, number of times per week they regularly pray, etc.) (high score = greater religiosity). What statistical test is most suitable to answer the research objective? a. Chi-Square Test b. Correlation Coefficient c. t-test d. ANOVAarrow_forwardYou are conducting a study to analyze gender differences in neurocognitive impairment (NCI) within a sample of cocaine-dependent methadone-maintained patients. You found 3 demographic characteristics that produced significant effects on NCI. They are gender, race, and age. Please answer both parts a and b. a) What statistical analysis would you use to see simultaneously the contributions of socio-demographic variables (gender (male/female), race (White, Black, Latino, Asian), and age (in years) on self-reported NCI, a normal continuous outcome (higher scores indicate higher NCI)? b) How many independent variables will there be in your model? Describe (1) what they are, (2) how you would create them, and (3) interpretation for each coefficient.arrow_forward
- An outbreak of gastritis occurred on a cruise ship. The data in the table below were obtained from a questionnaire completed by everyone on board the ship shortly after the outbreak. People who ate food People who did not eat food Food Sick well Sick Well Herring 200 800 100 900 Chicken 650 350 100 900 Spinach soufflé 200 800 500 500 Oysters 300 700 400 600 Chocolatemousse 600 400 450 550 A) what is the most likely infective food on the cruise ship? B) what is the relative risk of developing gastritis from herring consumption?arrow_forwardA study examined the relationship between a nurse's assessment of a patient's facial expression and his or her self-reported level of pain. Data for 89 patients are summarized below: Self-Report Facial Expression No Pain Pain No Pain 17 40 Pain 3 29 We'd like to determine if there is evidence of an association between a facial expression that reflects pain and self-report pain, because dementia patients do not always give a verbal indication that they are in pain. By using SPSS or Minitab, design the appropriate test and generate the data analyses. Relate the results of the test to the research question and conclude the findings.arrow_forwardEighteen participants took part in an experimental study that consisted of three levels: normal classroom teaching, normal classroom teaching with tutors, and an experimental teaching method to increase student scores on a statistics exam. Your data set includes the following variables: Treatment (1 - normal classroom teaching; 2 - normal classroom teaching with tutors; 3 - experimental teaching method) Gender (1 – female; 2 – male) Pre-test score (higher scores represent better student performance on a statistics exam) Post-test score (higher scores represent better student performance on a statistics exam) Stanford-Binet Intelligence Test scores (IQ) The number of hours the student studied per week. Do test scores at pre-treatment differ from test scores at post-treatment? Note, this analysis should be conducted ignoring the treatment group they are in. Select an appropriate statistical test and state teh hullhypothesis.arrow_forward
 Glencoe Algebra 1, Student Edition, 9780079039897...AlgebraISBN:9780079039897Author:CarterPublisher:McGraw Hill
 Calculus For The Life SciencesCalculusISBN:9780321964038Author:GREENWELL, Raymond N., RITCHEY, Nathan P., Lial, Margaret L.Publisher:Pearson Addison Wesley,
 Big Ideas Math A Bridge To Success Algebra 1: Stu...AlgebraISBN:9781680331141Author:HOUGHTON MIFFLIN HARCOURTPublisher:Houghton Mifflin Harcourt