
i.
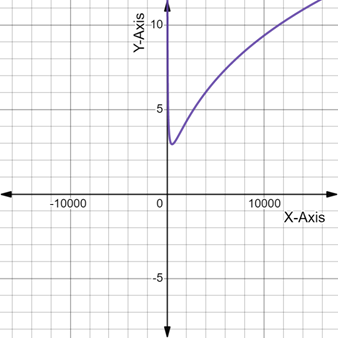
To graph: The function using graphing calculator.
Energy magnitude
Given:
The function
Explanation:
The following graph has been obtained using the graphing calculator.
ii.
To calculate: The number of fish species within the specified area.
Given:
The function
Calculation:
The
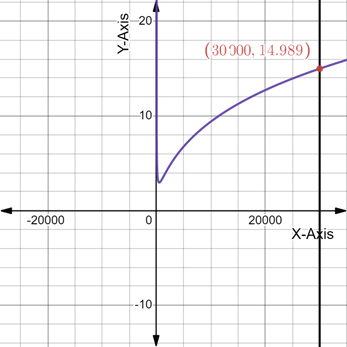
Conclusion:
The number of fish species is
iii.
To calculate: The area that contains the
Given:
The function
Calculation:
The number of species is
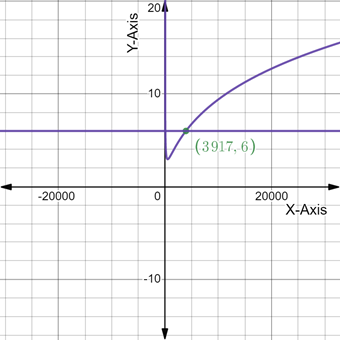
From the graph, the estimated area is
Conclusion:
The estimated area is
iv.
To explain: The effect of area on the number of species.
On increasing area, the number of species will increase.
Given:
The function
Calculation:
The graph of function is as follows:

The curve of the graph rises as we move towards the infinity. So, it can be concluded that the number of species will also rise because
Conclusion:
The number of species will increase on increasing area.
Chapter 4 Solutions
Holt Mcdougal Larson Algebra 2: Student Edition 2012

 Algebra and Trigonometry (6th Edition)AlgebraISBN:9780134463216Author:Robert F. BlitzerPublisher:PEARSON
 Contemporary Abstract AlgebraAlgebraISBN:9781305657960Author:Joseph GallianPublisher:Cengage Learning
 Linear Algebra: A Modern IntroductionAlgebraISBN:9781285463247Author:David PoolePublisher:Cengage Learning
 Algebra And Trigonometry (11th Edition)AlgebraISBN:9780135163078Author:Michael SullivanPublisher:PEARSON
 Introduction to Linear Algebra, Fifth EditionAlgebraISBN:9780980232776Author:Gilbert StrangPublisher:Wellesley-Cambridge Press
 College Algebra (Collegiate Math)AlgebraISBN:9780077836344Author:Julie Miller, Donna GerkenPublisher:McGraw-Hill Education