
BIOLOGY:CONCEPTS+APPL.(LOOSELEAF)
10th Edition
ISBN: 9781305967359
Author: STARR
Publisher: CENGAGE L
expand_more
expand_more
format_list_bulleted
Concept explainers
Videos
Textbook Question
Chapter 40, Problem 3CT
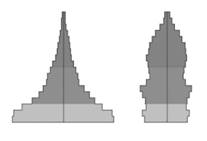
Age structure diagrams for two hypothetical human populations are shown below. Describe the growth rate of each population and discuss the current and future social and economic problems that each is likely to face.
Expert Solution & Answer
Want to see the full answer?
Check out a sample textbook solution
Students have asked these similar questions
Refer to the following graphs to answer the question that follows.
% life span
A
% lifespan
B
% lifespan
C
36. Which of the life history curves would be representative of "large animals that bear one or, at most, a
few offspring at a time and give them extended parental care?"
a. A
b. B
c. C
% surviving
Consider the evolution of the population of a species of small rodents. Assume that the number of males and females are nearly equal. Due to statistical data one can assume that each female remains a juvenile for one year and then becomes an adult, and that only adults have offspring. The reproduction rate is 2. The adult surviving rate is α. The juvenile surviving rate is 2/5. Initially the population counted 100 females and 40 juveniles. What values of the adult surviving rate will ensure that the population stabilize?
The world population reached seven billion in 2011. At current growth rate, it is expected to reach eight billion by 2024 and nine billion by 2037. However, many projections predict that the world population will level off at around 9 billion individuals. Why is the world population expected to level off?
Select one:
a. The global fertility rate has been decreasing for the past 20 years and is expected to decline even further.
b. More than a third of the world population is expected to be aged 60 years or above in 2100.
c. The Earth’s carrying capacity is estimated at 9 billion individuals, when the global birth rate and death rate become equivalent.
d. Recent technological and medical advances led to increased life expectancy, allowing individuals to live longer.
Chapter 40 Solutions
BIOLOGY:CONCEPTS+APPL.(LOOSELEAF)
Ch. 40 - Most commonly, individuals of a natural population...Ch. 40 - The rate at which population size grows or...Ch. 40 - Suppose 200 fish are marked and released in a...Ch. 40 - Prob. 4SACh. 40 - For a given species, the maximum rate of increase...Ch. 40 - _______ is a density-independent factor that...Ch. 40 - Prob. 7SACh. 40 - Prob. 8SACh. 40 - Compared to the less developed countries, the...Ch. 40 - An increase in infant mortality will _______ a...
Knowledge Booster


Learn more about
Need a deep-dive on the concept behind this application? Look no further. Learn more about this topic, biology and related others by exploring similar questions and additional content below.Similar questions
- When people think about living to an age far outside of normal expectations – say to 120 or even 150 years of age – they tend to think about their own lives and what they would do with such time. Extending the human lifespan to such lengths, however, might have drastic implications for public policy and the planet as a whole. Do you think that such an increased lifespan would be good for the population? Why or why not? Be thorough in your discussion of these factors.arrow_forwardThe following equation is used to calculate the population growth rate, Ro, per generation from a life table. Iy is survival probability from birth to age x and my is fecundity at age x. Ro = Elkm Multiplying ly and my and summing it over all age categories in the life table gives the population growth rate per generation because: Calculating the reproductive output for each age class requires considering the survival probability to that age (a dead individual does not reproduce) and the fecundity at that age by multiplying them with each other. Summing over reproductive output for all age classes gives the total per capita growth rate of the population The fecundity at each age is lower when the survival is higher because of energy constraints. Multiplying probability of survival and fecundity in each age class takes this trade-off into account. Summing over reproductive output for all age classes gives the total per capita growth rate of the population The resulting type of growth…arrow_forwardHelp mearrow_forward
- Two stable populations employ the same fertility schedule, but different mortality schedule. In both populations, 20% of women between exact ages 45-55 bear a female child annually. No child bearing occurs outside this span. In population A, there is no mortality until age 100 where all who reached age perish. In population B, 1% of each cohort dies within each single year of age with no survivors beyond age 100. Compute GRR, GRR and r for each population. ii) Determine the birth and death rate of each. Sketch the age distribution of each.arrow_forwardDescribe the age structures in rapidly growing countries, slowly growing countries, and countries with zero population growth.arrow_forwardDescribe the three types of population pyramids and their effect on society due to their characteristics.arrow_forward
- Sea otters can eat 20%-23% of their body weight in food each day. An average sea otter weighs 23 kg (roughly 50 pounds), and there are 20-30 otters per square kilometer where they are present. An average sea urchin weighs 0.55 kg. Assuming that the otters eat only sea urchins, use these data to calculate a conservative estimate of the number of sea urchins per square kilometer that an otter population would be expected to eat each year.arrow_forwardAnswer the following questions: Why do we usually express crude birth and death rates per thousand people? Why not give the numbers per person or for the entire population. Some demographers claim that the total world population has already begun to slow, while others dispute this claim. How would you recognize a true demographic transition as opposed in mere random fluctuations in birth and death rates?arrow_forwardWhich compares to the age structure of less developed and higher developed countries, specifying the x and y axis. Give an example of natioins with these types of age structure diagrams. What does a high fertility rate tell you about the future of this population.arrow_forward
- Consider the temperature effect in the sex determination of a turtle species represented in the graph below. 100 What effect would a decrease in temperature below the epivotal temperature have on sex ratios of these turtles? 50 FT MT Temperature Fewer males and females will result. None of the other answers is correct. No difference in the proportion of females to males will result as only colder temperatures will alter the sex ratio in the offspring. More males than females will result. More females than males will result. To Percent female O O O Oarrow_forwardA scientist constructs a graph to show the age structure of the human population of Country Y. The graph is shown here. Age Structure of the Human Population, Country Y I Male 100+ 95-99 90-94 85-89 80-84 75-79 70-74 65-69 60-64 55-59 50-54 45-49 40-44 35-39 30-34 25-29 20-24 15-19 10-14 5-9 0-4 Female 20% 10% 0% 10% 20% What conclusion is supported by the graph? 1 2 3 4 5 7 obyarrow_forwardAssume a population of desert tortoises has a per capita growth rate (r) or 0.039. If this rate could be sustained, how long would it take for the population that is currently 186 individuals to reach 450 individuals? (just give the simplest expression with the data provided). Edit View Insert Format Tools Table 12pt Paragraph BIU AT²arrow_forward
arrow_back_ios
SEE MORE QUESTIONS
arrow_forward_ios
Recommended textbooks for you
 Concepts of BiologyBiologyISBN:9781938168116Author:Samantha Fowler, Rebecca Roush, James WisePublisher:OpenStax College
 Lifetime Physical Fitness & WellnessHealth & NutritionISBN:9781337677509Author:HOEGERPublisher:Cengage
Concepts of Biology
Biology
ISBN:9781938168116
Author:Samantha Fowler, Rebecca Roush, James Wise
Publisher:OpenStax College
Lifetime Physical Fitness & Wellness
Health & Nutrition
ISBN:9781337677509
Author:HOEGER
Publisher:Cengage
POPULATION REGULATION AND LIMITING FACTORS | DENSITY INDEPENDENT AND DENSITY DEPENDENT FACTORS; Author: BioVidyalaya;https://www.youtube.com/watch?v=mB-AB-5Wnhs;License: Standard YouTube License, CC-BY
Population growth; Author: SiouxScience;https://www.youtube.com/watch?v=XnaC9iOumVA;License: Standard YouTube License, CC-BY