
MACROECONOMICS
14th Edition
ISBN: 9781337794985
Author: Baumol
Publisher: CENGAGE L
expand_more
expand_more
format_list_bulleted
Videos
Textbook Question
Chapter 4, Problem 4TY
The following table summarizes information about the market for principles of economics textbooks:
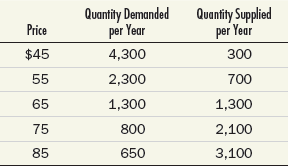
- What is the
market equilibrium price and quantity of textbooks? - To quell outrage over tuition increases, the college places a $55 limit on the price of textbooks. How many textbooks will be sold now?
- While the price limit is still in effect, automated publishing increases the efficiency of textbook production. Show graphically the likely effect of this innovation on the market price and quantity.
Expert Solution & Answer
Want to see the full answer?
Check out a sample textbook solution
Students have asked these similar questions
The following table represents the market for solar wireless
keyboards. Plot this data on a supply and demand graph
and identify the equilibrium price and quantity. Explain
what would happen if the market price is set at $60, and
show this on the graph. Explain what would happen if the
market price is set at $30, and show this on the graph.
Price
$ 10.00
20.00
30.00
40.00
50.00
60.00
70.00
Quantity
Demanded
28
24
20
16
12
8
4
Quantity
Supplied
0
3
6
9
12
15
18
जी
The demand and supply curves for T-shirts are given by the following equations, where P is the price and Q is the quantity.
Demand: Q = 65000 – 50P Supply: Q – 5000 = 250P
Find the equilibrium price and quantity.
The table below shows the monthly demand and supply of gallons of Ghana Nuts Oil at different prices. Use the information in the table to answer the questions that follows:
Price per gallon
Quantity of gallons demanded
Quantity of gallons Supplied
20
5000
1000
25
4000
2000
30
3000
3000
35
2000
4000
40
1000
5000
Use the information in the table to sketch the demand and supply curve on the same axis. (NOTE: Graph sheet is not needed).
What is the equilibrium price and quantity?
Which of the prices would cause shortages? Calculate the shortages that may occur at those prices.
Suppose the Government of Ghana imposes a minimum price legislation which led to surpluses in the oil market, discuss two ways that can be use to address or mitigate the surpluses in the market.
Suppose the price of Ghana Nut Oil increase from 20 to 25, calculate the price elasticity of demand and supply of Ghana Nut Oil.
Demand and Supply which one is more…
Knowledge Booster


Learn more about
Need a deep-dive on the concept behind this application? Look no further. Learn more about this topic, economics and related others by exploring similar questions and additional content below.Similar questions
- For each of the following events described, indicate the effects to the demand and to the supply. Use the demand and supply graphs provided below to match these events. Then determine what happens to the market equilibrium price and equilibrium quantity. Scenario: Before economic reforms were implemented in the countries of Eastern Europe, regulation held the price of bread substantially below equilibrium. When reforms were implemented, prices were deregulated and they rose dramatically. As a result, the quantity demanded for bread dramatically fell and the quantity supplied for supplied rose sharply. Change in Demand * Increase Decrease Did not Change Indeterminate Change in Supply * Increase Decrease Did not Change Indeterminate Graph * So D: Do Do A В O A В So So Do Do Q D O c O D P So So Do D- E F O E F P S. So So Do Do G H So P So D1 Do Do D1 Q -Q J J S: So Do O K Change in market equilibrium price. * Increase Decrease Did not Change O Indeterminate Change in market equilibrium…arrow_forwardThe following graph shows the supply curve for sedans in an imaginary market. For simplicity, assume that all sedans are identical and sell for the same price. Two factors that affect the supply of sedans are the level of technical knowledge in this case, the speed with which manufacturing robots can fasten bolts, or robot speed-and the wage rate that auto manufacturers must pay their employees. Initially, the graph shows the supply curve when robots can fasten 2,500 bolts per hour and autoworkers earn $25 per hour. Use the graph input tool to help you answer the following questions. You will not be graded on any changes you make to this graph. Note: Once you enter a value in a white field, the graph and any corresponding amounts in each grey field will change accordingly. PRICE (Thousands of dollars) 50 40 30 20 O Supply 0 100 200 300 400 500 600 700 800 900 QUANTITY (Sedans per month) Graph Input Tool Supply for Sedans Price of a Sedan (Thousands of dollars) Quantity Supplied (Sedans…arrow_forward
Recommended textbooks for you


 Microeconomics: Private and Public Choice (MindTa...EconomicsISBN:9781305506893Author:James D. Gwartney, Richard L. Stroup, Russell S. Sobel, David A. MacphersonPublisher:Cengage Learning
 Macroeconomics: Private and Public Choice (MindTa...EconomicsISBN:9781305506756Author:James D. Gwartney, Richard L. Stroup, Russell S. Sobel, David A. MacphersonPublisher:Cengage Learning
 Economics: Private and Public Choice (MindTap Cou...EconomicsISBN:9781305506725Author:James D. Gwartney, Richard L. Stroup, Russell S. Sobel, David A. MacphersonPublisher:Cengage Learning
Microeconomics: Private and Public Choice (MindTa...
Economics
ISBN:9781305506893
Author:James D. Gwartney, Richard L. Stroup, Russell S. Sobel, David A. Macpherson
Publisher:Cengage Learning
Macroeconomics: Private and Public Choice (MindTa...
Economics
ISBN:9781305506756
Author:James D. Gwartney, Richard L. Stroup, Russell S. Sobel, David A. Macpherson
Publisher:Cengage Learning
Economics: Private and Public Choice (MindTap Cou...
Economics
ISBN:9781305506725
Author:James D. Gwartney, Richard L. Stroup, Russell S. Sobel, David A. Macpherson
Publisher:Cengage Learning
What is Efficiency?; Author: Marketing Business Network;https://www.youtube.com/watch?v=HtyE1V6jXek;License: Standard Youtube License