
Videos
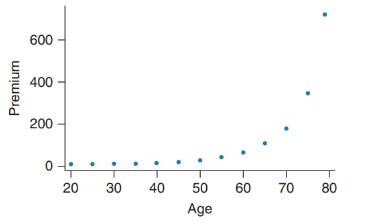
Life Insurance and Age The graph shows the monthly premiums for a 10-year
a. Explain what the graph tells us about life insurance rates for males at different ages. Explain why life insurance rates might follow this trend.
b. Would it be appropriate to do a linear
Want to see the full answer?
Check out a sample textbook solution
Chapter 4 Solutions
Introductory Statistics
Additional Math Textbook Solutions
APPLIED STAT.IN BUS.+ECONOMICS
An Introduction to Mathematical Statistics and Its Applications (6th Edition)
Elementary Statistics
EBK STATISTICAL TECHNIQUES IN BUSINESS
Elementary Statistics Using The Ti-83/84 Plus Calculator, Books A La Carte Edition (5th Edition)
PRACTICE OF STATISTICS F/AP EXAM


- If you graph a revenue and cost function, explain how to determine in what regions there is profit.arrow_forwardStock Market The week of September 15, 2008 was one of the most volatile weeks ever for the US stock market. The closing numbers of the Dow Jones Industrial Average each day were: What was the overall change for the week? Was it positive or negative?arrow_forward
 Glencoe Algebra 1, Student Edition, 9780079039897...AlgebraISBN:9780079039897Author:CarterPublisher:McGraw Hill
 Mathematics For Machine TechnologyAdvanced MathISBN:9781337798310Author:Peterson, John.Publisher:Cengage Learning,
 Calculus For The Life SciencesCalculusISBN:9780321964038Author:GREENWELL, Raymond N., RITCHEY, Nathan P., Lial, Margaret L.Publisher:Pearson Addison Wesley,
 Elementary AlgebraAlgebraISBN:9780998625713Author:Lynn Marecek, MaryAnne Anthony-SmithPublisher:OpenStax - Rice University
 Holt Mcdougal Larson Pre-algebra: Student Edition...AlgebraISBN:9780547587776Author:HOLT MCDOUGALPublisher:HOLT MCDOUGAL