Videos
Income Statement for Year Ended December 31, 2018 (Millions of Dollars)
| Net sales | $795.0 |
| Cost of goods sold | 660.0 |
| Gross profit | $135.0 |
| Selling expenses | 73.5 |
| EBITDA | $ 61.5 |
| 12.0 | |
| Earnings before interest and taxes (EBIT) | $ 49.5 |
| Interest expenses | 4.5 |
| Earnings before taxes (EBT) | $ 45.0 |
| Taxes (40%) | 18.0 |
| Net income | $ 27.0 |
- a. Calculate the ratios you think would be useful in this analysis.
- b. Construct a DuPont equation, and compare the company’s ratios to the industry average ratios.
- c. Do the balance-sheet accounts or the income statement figures seem to be primarily responsible for the low profits?
- d. Which specific accounts seem to be most out of line relative to other firms in the industry?
- e. If the firm had a pronounced seasonal sales pattern or if it grew rapidly during the year, how might that affect the validity of your ratio analysis? How might you correct for such potential problems?
a.
To determine: The ratios that would be useful in this analysis.
Current Ratio:
Current ratio is a part of liquidity ratio, which reflects the capability of the company to payback its short-term debts. It is calculated based on the current assets and current liabilities that a company possess in an accounting period.
Ratio Analysis:
Ratio is used to compare two arithmetical figures. In case of the ratio analysis of the company, the financial ratios are calculated. The financial ratios examine the performance of the company and is used in comparing with other same business. It indicates relationship of two or more parts of financial statements.
Explanation of Solution
Given information:
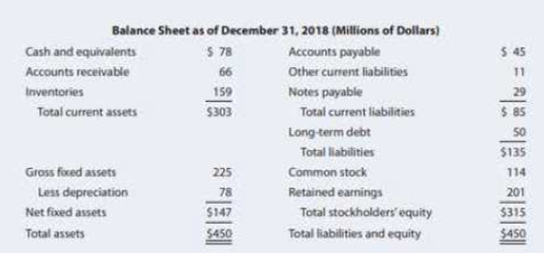
Current assets are $303.
Current liabilities are $85.
The formula to calculate current ratio is as follows:
Substitute $303 for current assets and $85 for current liabilities.
Thus, current ratio is 3.56 times.
Fixed Assets Turnover Ratio:
It reflects the efficiency of the company to utilize fixed asset to increase sale.
Given information:
Sales are $795.
Net fixed assets are $147.
The formula to calculate fixed assets turnover is as follows:
Substitute $795 for total sales and $`147 for fixed assets in above formula.
Thus, fixed assets turnover is 5.40 times.
Debt-to-Capital Ratio:
It is percentage of total capital that is financed by the borrowed fund. Borrowed fund includes short and long-term debts. Operating debt like account payable, accrual are not considered.
Given information:
Total debt is $79 (working note).
Equity is $315 (working note).
The formula of Debt-to-capital ratio is as follows:
Substitute $79 for total debt and $315 for equity in above formula.
Thus, debt-to-capital ratio is 20.05%.
Working notes:
Compute total debt.
Given information:
Long-term debt is $50.
Notes payable is $29.
Calculation of total debt of the company is as follows:
Thus, total debt is $79.
Compute the total value of the common equity is as follows:
Given information:
Common stock is $114.
Retained earnings are $201.
Formula to calculate common equity is as follows:
Substitute $114 for common stock and $201 for retained earnings.
Thus, common equity is $315.
Total Assets Turnover Ratio:
It indicates how effectively the asset of a company is utilized. Total asset is the sum of current assets and fixed assets.
Given,
Total sales is $795
Total assets are $450.
Formula to calculate total assets turnover is,
Substitute $795 for total sales and $450 for total assets.
Thus, total assets turnover is 1.76 times.
Times-Interest Earned Ratio:
It is the type of solvency ratio that indicates the capability of business to repay interest and provide debt related services.
Given,
Earnings before interest and tax (EBIT) are $49.5.
Interest expense is $4.5.
Formula to calculate times interest earned is as follows:
Substitute $49.5 for EBIT and $4.5 for interest expense.
Thus, the times interest earned ratio is 11%.
Profit Margin
Profit margin is the ratio net income of the company and total sales. It is one of the profitability ratios.
Given information:
Net income is $27.
Sales are $795.
Formula to calculate profit ratio is as follows:
Substitute $27 for net income and $795 for sales in above formula.
Thus, profit ratio is 3.40%.
Return on Assets:
It is a profitability ratio. This ratio shows profit earning capability on per dollar of assets. It shows the percentage of net income on total assets. Higher the return on assets better the profitability. Total assets include fixed as well as current assets.
Given information
Net income is$27.
Total asset is $450.
Formula to calculate return on assets is,
Substitute $27 for net income and $450 for total value of assets.
Thus, return on assets is 6%.
Inventory Turnover Ratio:
Inventory turnover ratio reflects the number of times average inventory is converted into sales during the period under consideration. It is used to measures the efficiency of business operations.
Given information:
Total sales are $795.
Total inventory is $159.
Formula to calculate inventory turnover ratio is as follows:
Substitute $795 for total sales and $159 for total inventory.
Thus, inventory turnover ratio is 5 times.
Return on Equity:
Return on equity is the return earned from the capital invested in equity. It is the ratio of net income and shareholders’ equity. This ratio measures the performance of the company and tells how well the company is performing. This ratio is used to compare own firm with competitors.
Given information:
Net income is $27.
Common equity is $315 [Equation (2)].
Formula to calculate return on equity is as follows:
Substitute $27 for net income and $315 for common equity.
Thus, return on equity is 8.57%.
Days Sales Outstanding
Days sales outstanding is used to measure days that a business usually requires to collects its receivable in average. It indicates account receivable of the firm and firm’s efficiency in collecting the account receivable.
Given information
Receivables are $66.
Annual sale is $795.
Formula to calculate day’s sales outstanding is as follows:
Substitute $66 for account receivables and $795 for annual sales.
Thus, day’s sales outstanding is 30.30 days.
Return on Invested Capital:
It represent the amount of return earned by all investors and can be calculated by dividing total earnings available for investors to total invested capital.
Given information:
Earnings before interest and tax (EBIT) are $49.5.
Tax rate is 40%.
Total debt is $79 [equation (1)]
Total equity is $315[equation (2)]
Substitute $49.5 for EBIT, $79 for debt, 40% for the tax rate and $315for equity.
Thus, return on invested capital is 7.53%.
b.
To determine: DuPont equation and comparison of company’s ratio with industry average ratio.
Du Pont Equation:
Among all ratios, return on equity is very common. It shows the value of the firm. Improvement in the ROE is considered as valued addition to the firm. ROE can be linked with other ratios. Analysis of such ratios will indicate proper reason for change in ROE. The combination is known as Du Pont equation, which is shown below.
Explanation of Solution
Given information:
Return on equity (ROE) is 8.57%.
Net income of the company is$27.
Sales of the company are $795.
Total assets are $450.
Total common equity is $315.
The Du point relation of the company’s ratios is shown below,
Substitute $27 for net income, $795 for sales, $450 for total assets and $315 for common equity
Thus DuPont equation is
Comparison:
| Profit Margin | Total Assets Turnover | Equity Multiplier | ROE | |
| Firm | 3.40% | 1.76 times | 1.429 times | 8.57% |
| Industry | 3% | 3 times | 1.249times | 12.86% |
Table (1)
- After analyzing the Du sPont, equation total asset turnover of the firm is lower than industry’s average. Probably firm is carrying more assets than required to carry to support its sales. The firm should increase it sales.
- The return on equity is lower than industry average but the profit margin is higher than industry’s average.
Working notes:
Calculate Industry’s equity multiplier.
Given information:
Industry’s ROE is 12.86%.
Total assets turnover is 3 times.
Profit margin is 3%.
The formula to calculate ROE is as follows:
Substitute 12.86% for ROE, 3% for the profit margin and 3 times for total assets turnover.
Thus, equity multiplier is 1.429 times.
Therefore, DuPont equation has been constructed and the company’s ratios are compared with industry average ratios.
c.
To identify: The balance sheet accounts or income statement figures are primarily responsible for the low profits or not.
Answer to Problem 24P
- Net income is calculated from the income statement so it can be said the income statement figures are accountable for low profits.
- If the firm has not enough cash and other resources and has, too much debt it will results in low sales and funds to get necessary resources. Thus, the items of balance sheet are also responsible for the low profits.
Explanation of Solution
- The figures of income statement like sales, operating expenses affect the profit. If the sale is high, the net income is also high and sales decreases it will decrease profit of the firm. Similarly if there is an increase or decrease in the operating expenses the profit will be affected directly. Therefore, it can be said the income statement items are responsible for low profit.
- The items of balance sheet accounts like cash, inventory debt and capital affect the profit of the firm. If the level of inventory is too high or the debt is too high it can results in low profit. Thus, it can be said the balance sheet items are somehow responsible for lower profit.
Therefore, the balance sheet accounts and income statement figures are responsible for low profit.
d.
To identify: The specific accounts seems to be most out of line comparative to other companies in the same industry.
Answer to Problem 24P
The specific account, which seems to be most out of line relative to the other firms in the same industry, is given below:
- Fixed assets turnover
- Inventory turnover ratio
- Total assets turnover
- Return on assets
- Return on equity
- Return on invested capital(ROIC)
Explanation of Solution
- The fixed asset turnover of the firm is 5.40 times while the industry average is 6 times. It can be said that the ratio is low in comparison to that of the other firm in industry.
- Inventory turnover of 5 times while industry has 10 times. The firm ratio seems out of line to the other firms in the same industry.
- Total assets turnover of firm is 1.76 times is too low in comparison to industry average that is 3 times. It seems out of the line to other firms in the same industry.
- Return on asset of firm is 6% and industry average is 9%, which indicates the firm has lower ratio than other firm in same industry.
- Return on common equity of the firm is 8.57% and average of the industry is 12.86%. The firm got lower ratio than the other firms did which makes firm out of line to the other firm in the same industry.
- Return on invested capital of the firm is 7.53% while the industry average is 11.50%. It shows the firm ratio somehow out of line relative to the other firm.
Therefore, Fixed Assets turnover, inventory turnover ratio, total assets turnover, return on asset, return on equity, and return on invested capital (ROIC)seems to be most out of line comparative to other firms in the same industry.
(e)
To identify: The validity of the ratio analysis if the firm had marked seasonal sales pattern or if the sales grew rapidly during the year and the way of correcting potential problems.
Answer to Problem 24P
- If the sales of the company grew rapidly many ratios such related to cash, receivables, inventories and current liabilities might be distorted. Similarly ratios which are based on sales, profit, and common equity could be influenced.
- This type of problem can be corrected by using average figure instead of ending figures.
Explanation of Solution
The increase in sale affects the ratios which are calculated being based on the sales. The increases in sales increases the cash balance, receivables and it also affect the net income of the company. The ratio will get influenced from such increase.
Therefore, if the firm had pronounced seasonal sales and if the sales grew quickly during the year the ratios will get distorted and such problem can be solved by taking average figure rather than end period figures.
Want to see more full solutions like this?
Chapter 4 Solutions
Fundamentals of Financial Management (MindTap Course List)


- Use the following information for Taco Swell, Inc., (assume the tax rate is 24 percent): 2017 2018 Sales $ 15,573 $ 15,336 Depreciation 1,741 1,816 Cost of goods sold 4,379 4,787 Other expenses 986 864 Interest 835 966 Cash 6,187 6,706 Accounts receivable 8,120 9,667 Short-term notes payable 1,250 1,227 Long-term debt 20,560 24,836 Net fixed assets 51,064 54,513 Accounts payable 4,512 4,884 Inventory 14,419 15,368 Dividends 1,350 1,698 Prepare a balance sheet for this company for 2017 and 2018. (Do not round intermediate calculations.) Prepare an income statement for this company for 2017 and 2018. (Do not round intermediate calculations. Round your answers to 2 decimal places, e.g., 32.16. Input all answers as positive values.)arrow_forwardCommon-Size Income Statement 2016 Revenues $ 29,970 % Cost of goods sold (20,030) Gross profit $ 9,940 % Operating expenses (8,030) Net operating income $ 1,910 % Interest expense (860) Earnings before taxes $ 1,050 % Income taxes (382) Net income $ 668 % Required: 1) Prepare Common size income statementarrow_forwardThe following are the financial statement JNC Ltd. for the year ended 31 March 2020: JNC Ltd. Income statement For the year ended 31 March 2020 $”M” Revenue 1276.50 Cost of sales (907.00) 369.50 Distribution costs (62.50) Administrative expenses (132.00) 175.00 Interest received 12.50 Interest paid (37.50) 150.00 Tax (70.00) Profit after tax 80.00 JNC Ltd. Statement of financial position as at 31 March 2020 2019 $”M” $”M” ASSETS: Non- current assets: Property, plant and equipment 190 152.5 Intangible assets 125 100 Investments 12.5 Current assets: Inventories 75 51 Receivables 195 157.5 Short-term investment 25 Cash in hand 1 0.5 Total assets 611 474 Equity and liabilities: Equity: Share capital (10 million ordinary shares of $ 10 per value) 100 75 Share premium 80 75 Revolution reserve 50 45.5 Retained earnings 130 90 Non-current liabilities: Loan 85 25…arrow_forward
- The following information is available for Sunland Corporation for the year ended December 31, 2022: sales revenue $840,000, other revenues and gains $91,000, operating expenses $101,000, cost of goods sold $466,000, other expenses and losses $30,500, and preferred stock dividends $40,950. The company's tax rate was 20%, and it had 70,000 common shares outstanding during the entire year. (a) Your Answer Correct Answer Your answer is partially correct. Prepare a corporate income statement. (List other revenues before other expenses.)arrow_forwardColeman, Inc. provides the following data from its Income Statement for 2018: Net Sales $ 560,000.00 Cost of Goods Sold $ (160,000.00) Gross Profit $ 400,000.00 Calculate the gross profit percentage. (round your answer to two decimal places) A 71.43% B 25.00% C 100.00% D 28.57%arrow_forwardConsider the following income statement: Sales Costs Depreciation Taxes Calculate the EBIT. EBIT $748,168 486,752 110,700 Net income 23% Calculate the net income.arrow_forward
- Consider the following income statement: Sales Costs $ 602,184 391,776 Depreciation 89,100 Taxes Calculate the EBIT. EBIT 21% Calculate the net income. Net incomearrow_forwardDetermining Gross Profit During the current year, merchandise is sold for $45,870,000. The cost of the merchandise sold is $33,026,400. a. What is the amount of the gross profit? 12,843,600 b. Compute the gross profit percentage (gross profit divided by sales). % c. When will the income statement necessarily report a net income?arrow_forwardComparative income statements and balance sheets for F&N are shown below ($ millions): Year 2 Year 1 Income Statement $19,889 6,204 Net sales. $20,092 6,044 Cost of goods Gross profit. Selling, general, and administrative expense Depreciation and amortization expense Interest expense (revenue) 14,048 7,893 803 (308) 13,685 9,221 773 292 3,399 1,222 Income before tax 5,660 1,691 Income tax expense. Net income $ 3,969 $ 2,177 Outstanding shares 3,491 3,481arrow_forward
- The following are the comparative financial statements for Outland Corporation for 2020 and 2019: OUTLAND CORPORATION Statement of Income For Periods Ending October 31 Sales Revenue Cost of Goods Sold Gross Profit.. 2020 167,500 100,000 67,500 2019 140,000 85,000 55,000 Expenses Depreciation Selling and Administrative Interest Expense. Total Expenses. 15,000 22,500 15,000 15,000 47,500 35,000 Net Income (before taxes). Income Taxes 25,000 10,000 15,000 22,500 7,500 15,000 Net Income OUTLAND CORPORATION Statement of Financial Position As at October 31 2020 2019 Assets Current Assets: 4,000 10,000 35,000 31,000 80,000 Cash. 2,500 7,500 30,000 25,000 65,000 Marketable Securities. Accounts Receivable. Inventory Total Current Assets Investments (at cost).. 30,000 32,500 Property, plant and equipment Property, Plant and Equipment.. Less: Accumulated Depreciation. 200,000 87,500 112,500 2,500 225,000 190,000 80,000 110,000 2,500 210,000 Goodwill Total Assets Liabilities and Shareholders'…arrow_forwardUse the below information to answer the following question. Sales Cost of goods sold Depreciation Income Statement For the Year Taxable income Taxes Earnings before interest $4,500 and taxes Interest paid Net income Dividends $900 Balance Sheet End-of-Year Cash Accounts receivable Inventory Total current assets Net fixed assets Total assets Accounts payable Long-term debt Common stock ($1 par value) Retained earnings O O O O Total Liab. & Equity 33 percent 40 percent 50 percent $28,400 60 percent 21,200 2,700 67 percent 850 $3,650 1,400 $2,250 $550 2,450 4,700 $7,700 What was the retention ratio? 16,900 $24,600 $ 2,700 9,800 8,000 4,100 $24,600arrow_forwardDetermining Gross Profit During the current year, merchandise is sold for $11,750,000. The cost of the goods sold is $7,050,000. a. What is the amount of the gross profit?$ b. Compute the gross profit percentage (gross profit divided by sales). Round to the nearest whole number. % c. When will the income statement report net income?arrow_forward
 Fundamentals of Financial Management (MindTap Cou...FinanceISBN:9781337395250Author:Eugene F. Brigham, Joel F. HoustonPublisher:Cengage Learning