
Concept explainers
Videos
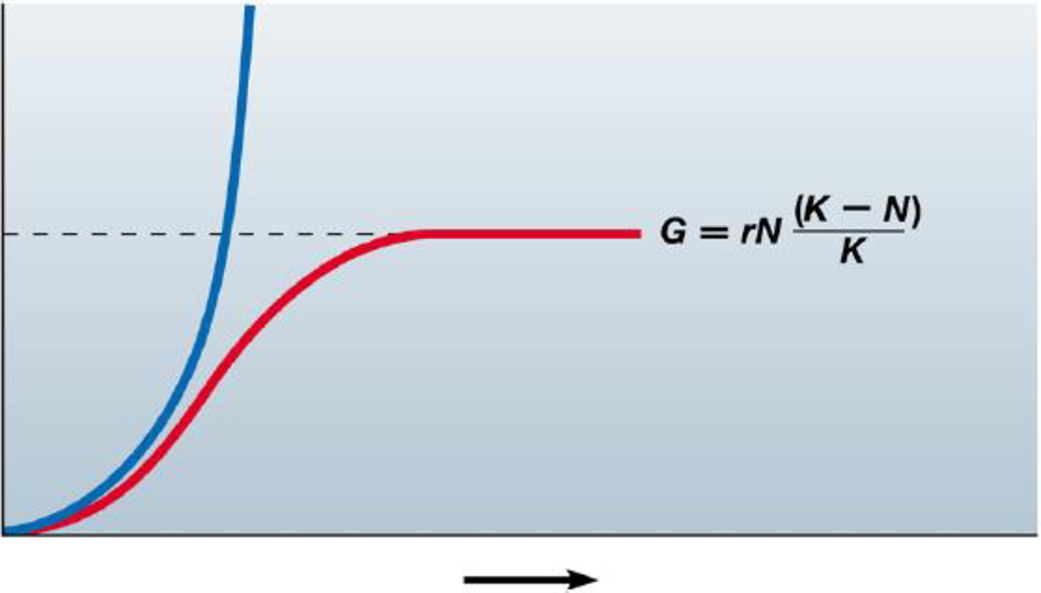
Use this graph of the idealized exponential and
a. Label the axes and curves on the graph.
b. Give the formula that describes the blue curve.
c. What does the dotted line represent?
d. For each curve, indicate and explain where population growth is the most rapid.
e. Which of these curves best represents global human population growth?
a.
To label: The axis and the curves of the graph.
Introduction: Exponential growth curve is the J-shaped curve that is ever increasing in nature. The logistic growth curve is an S shaped curve in which the growth of the population ceases after a certain point which can be represented as the carrying capacity of the population.
Answer to Problem 1CC
Correct answer:
X-axis is time, Y-axis is population size. Blue/thick curve is the exponential growth and red/thin curve is logistic curve
Explanation of Solution
Graphical representation: Fig: 1 shows the graph depicting the logistic and exponential growth curve.
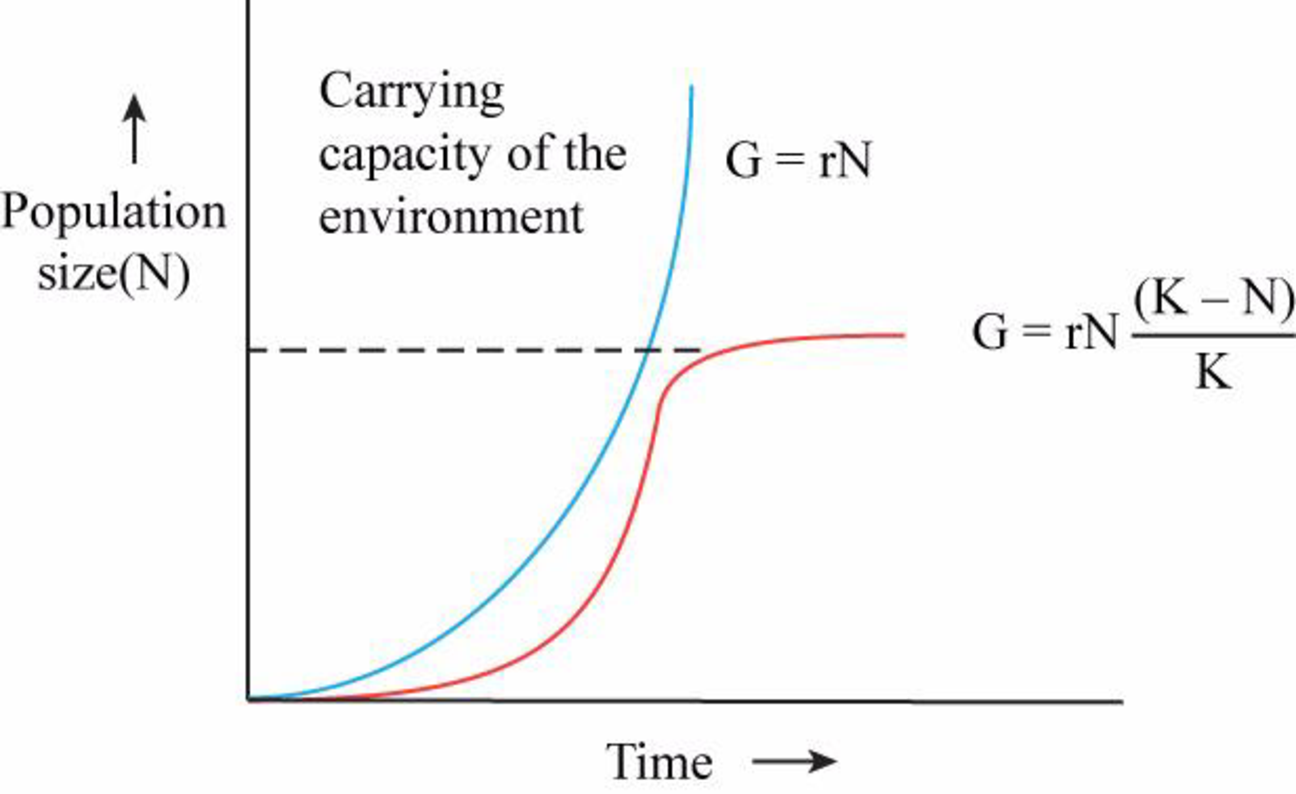
Fig. 1: The graph depicting the logistic and exponential growth curve.
The X-axis of the graph represents the time taken for growth and the Y-axis of the graph represents the size of the population. The blue/thick curve is the exponential growth curve and red/thin curve is logistic growth curve. Hence the correct answer is X-axis is time, Y-axis is population size. Blue/thick curve is the exponential growth and red/thin curve is logistic curve
b.
To give: The formula that describes the blue curve.
Answer to Problem 1CC
Correct answer:
Explanation of Solution
Refer to Fig.1; the blue curve can be described by the formula
c.
To determine: What does the dotted line represents.
Answer to Problem 1CC
Correct answer:
Carrying capacity of the environment (K)
Explanation of Solution
Refer to Fig.1; the dotted line represented on the graph is the carrying capacity of the environment. Hence the correct answer is carrying capacity of the environment (K)
d.
To determine: What does each curve represents.
Answer to Problem 1CC
Correct answer:
Population of logistic curve is most rapid at half of the carrying capacity. Population of exponential growth is most rapid throughout the curve as it is continuously increasing.
Explanation of Solution
Refer to Fig.1; the population growth is most rapid when population attains half of the carrying capacity in logistic curve and the population growth is continuously increasing in the exponential growth curve. Hence the correct answer half of the carrying capacity in logistic curve and continuous growth in exponential growth.
e.
To determine: The curve which represents the global human population.
Answer to Problem 1CC
Correct answer:
Exponential growth curve
Explanation of Solution
Refer to Fig.1; it is the J shaped curve that is continuously increasing is the exponential growth curve. The worldwide population can be represented by this curve as the population is ever increasing. Hence the correct answer is exponential growth curve.
Want to see more full solutions like this?
Chapter 36 Solutions
Campbell Biology Concepts and Connections, Third custom edition for Orange Coast College, Includes Online Access code.


- Make a graph in Excel using the data ( the image ) This data represents results from a fictional study comparing bee body weight to insecticide exposure. a. Tittleb. The graph can be any style or format but must display a relationship between the independent (x axis) and dependent (y axis) variables.c. Both axis of the graph must be correctly labeled, including correct units, andrepresent the independent and dependent variables.d. The graph must contain a trendline with a trendline equation and R2 valuearrow_forwardYou monitor the white-tailed deer population for the Wright State campus and woods and estimate 14 deer in the first year and 21 deer in the second year. (A) Assume the deer population is growing geometrically. Based on these data, what is geometric growth rate constant (A)? (B) Geometric growth patterns can also be modeled exponentially. If modeled exponentially, would you expect the exponential growth rate constant () to be greater than, less than, or equal to 0? Why? You monitor the deer population for many years. The population grows for a few more years, then seems to stabilize around 75 deer. (C) Given this information, what would be a more appropriate model for the deer population growth? Why? (D) What factors might be limiting the population growth? Would these factors be considered density-dependent or density- independent factors? Why? it is equal to zero. The correct answer is not displayed for Written Response type questions. Hide Feedback (A) Check geometric growth…arrow_forwardA region of North America has a population of 65,000 deer in 2016. The deer are kept in check by a wolf population. The carrying capacity of this region allows for 82,000 deer. For this example, assume the rmax is 1.0. With this information, answer/calculate the following:arrow_forward
- Draw a graph with a growth curve for a population that starts at 10 individuals and experiences exponential growth. Draw a second graph with a growth curve for a population that starts with 10 individuals and undergoes logistic growth. The second graph should have a carrying capacity of 100 individuals. Please give a proper written explanation for the graphs.arrow_forwardRegarding the population growth of Canada geese, which of the following statements is most likely true? O The population is increasing at a constant rate with time. O If modeled geometrically, A should be greater than 0, because the population is increasing. If modeled exponentially, r should be greater than 0, because the population is increasing. O None of the above statements is true.arrow_forwardThe per capita birth (b) and death (d) rates are measured for two populations across a range of population sizes in the attached figure. The equation for exponential growth rate is dN/dt=rN where the per capita growth rate is r=(b-d). The equation for logistic population growth rate is dN/dt=rN(1-N/K). With logistic growth, r varies as a function of the population size with density-dependent birth and/or death rates. See attached image If the death rate decreased, what would happen to the population trajectory for population A? a) increase faster b) increase slower c) decrease faster d) decrease slowerarrow_forward
- The island of Isle Royale in Lake Superior has historically contained both moose and wolves. In recent years, the number of wolves has dwindled, leaving few predators for the moose. This has led to a large increase in the moose population on the island. The following information is from 2018. Using this information and the equation shown, the growth rate for the moose population on Isle Royale can be calculated. Based on the current population and the growth rate, what type of growth model would be expected? K = 2,000 moose N = 1,500 moose Rmax = 0.5 where: dt = change in time N=population size ax =maximum per capita growth rate of population K= carrying capacity A logistical growth model would best represent this population because the moose population will decrease over time. An exponential growth model would best represent this population because there are few predators for the moose on this island. A logistical growth model would best represent this population because the increase…arrow_forwardThe island of Isle Royale in Lake Superior has historically contained both moose and wolves. In recent years, the number of wolves has dwindled, leaving few predators for the moose. This has led to a large increase in the moose population on the island. The following information is from 2018. Using this information and the equation shown, the growth rate for the moose population on Isle Royale can be calculated. Based on the current population and the growth rate, what type of growth model would be expected? A - A logistical growth model would best represent this population because the moose population will decrease over time. B - An exponential growth model would best represent this population because there are few predators for the moose on this island. C - A logistical growth model would best represent this population because the increase in the number of moose would level off over time. D - An exponential growth model would best represent this population because the moose…arrow_forwardA population that did not grow in close relation to the amount of resources available in the environment, and dramatically overshot the carrying capacity, would experience: A. logistic growth, such as shown on the S-shaped curve B. exponential growth, such as shown on the J-shaped curve C. unpredictable growth, such as shown on the ?-shaped curve D. exponential growth, such as shown on the S-shaped curve E.logistic growth, such as shown on the J-shaped curvearrow_forward
- Write a model for discrete population growth from t=0 to t=1. Assume that the population is ‘closed’. Define your terms.arrow_forwardShow how you build the logistic model for population growth from the exponential model equation? What part of the logistic growth equation produces the sigmoidal growth curve?arrow_forwardA population that grew in close relation to the amount of resources available in the environment, would experience A. exponential growth, such as shown on the J-shaped curve B. logistic growth, such as shown on the S-shaped curve C. unpredictable growth, such as shown on the ?-shaped curve D.logistic growth, such as shown on the J-shaped curve E. exponential growth, such as shown on the S-shaped curvearrow_forward
 Human Anatomy & Physiology (11th Edition)BiologyISBN:9780134580999Author:Elaine N. Marieb, Katja N. HoehnPublisher:PEARSON
 Biology 2eBiologyISBN:9781947172517Author:Matthew Douglas, Jung Choi, Mary Ann ClarkPublisher:OpenStax
 Anatomy & PhysiologyBiologyISBN:9781259398629Author:McKinley, Michael P., O'loughlin, Valerie Dean, Bidle, Theresa StouterPublisher:Mcgraw Hill Education,
 Molecular Biology of the Cell (Sixth Edition)BiologyISBN:9780815344322Author:Bruce Alberts, Alexander D. Johnson, Julian Lewis, David Morgan, Martin Raff, Keith Roberts, Peter WalterPublisher:W. W. Norton & Company
 Laboratory Manual For Human Anatomy & PhysiologyBiologyISBN:9781260159363Author:Martin, Terry R., Prentice-craver, CynthiaPublisher:McGraw-Hill Publishing Co.
 Inquiry Into Life (16th Edition)BiologyISBN:9781260231700Author:Sylvia S. Mader, Michael WindelspechtPublisher:McGraw Hill Education