
Videos
Clocking the Cheetah. The cheetah (Acinonyx jubatus) is the fastest land mammal and is highly specialized to run down prey. The cheetah often exceeds speeds of 60 miles per hour (mph) and, according to the online document “Cheetah Conservation in Southern Africa” (Trade & Environment Database (TED) Case Studies, Vol. 8, No. 2) by J. Urbaniak, the cheetah is capable of speeds up to 72 mph. The following table gives the top speeds, in miles per hour, arranged in increasing order, for a sample of 35 cheetahs.
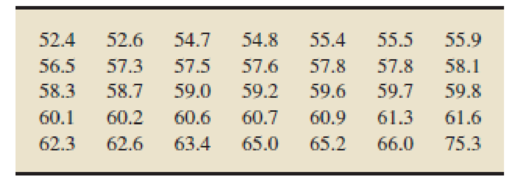
The sample
- a. Is it reasonable to apply the
empirical rule to estimate the percentages of observations that lie within one, two, and three standard deviations to either side of the mean? - b. Use the empirical rule to estimate the percentages of observations that lie within one, two, and three standard deviations to either side of the mean.
- c. Use the data to obtain the exact percentages of observations that lie within one, two, and three standard deviations to either side of the mean.
- d. Compare your answers in parts (b) and (c).
Want to see the full answer?
Check out a sample textbook solution
Chapter 3 Solutions
Introductory Statistics (10th Edition)


- The deadly Ebola virus is a threat to both people and gorillas in Central Africa. An outbreak in 2002 and 2003 killed 91 of the 95 gorillas in seven home ranges in the Congo. To study the spread of the virus, measure "distance" by the number of home ranges separating a group of gorillas from the first group infected. Here are data on distance and time in number of days until deaths began in each later group. (Data set may be found here.) Distance 1 3 4 4 4 5 Time 4 21 33 41 43 46 (a) Make a scatterplot. Which is the explanatory variable? What kind of pattern does your plot show?(b) Find the correlation r between distance and time.arrow_forwardThe deadly Ebola virus is a threat to both people and gorillas in Central Africa. An outbreak in 2002 and 2003 killed 91 of the 95 gorillas in seven home ranges in the Congo. To study the spread of the virus, measure "distance" by the number of home ranges separating a group of gorillas from the first group infected. Here are data on distance and time in number of days until deaths began in each later group. (Data set may be found here.) Distance 1 3 4 4 4 5 Time 4 21 33 41 43 46 (a) Make a scatterplot. Which is the explanatory variable? distance time either distance or time Correct: Your answer is correct. What kind of pattern does your plot show? There is a strong positive linear association between distance and time. There is a strong negative linear association between distance and time. There is little to no association between distance and time. Correct: Your answer is correct. ( b) Find the correlation r between distance and time. (Round your answer to four decimal places.) (c)…arrow_forwardIn a study, the effects of the mane of a male lion as a signal of quality to mates and rivals was explored. Four life-sized dummies of male lions provided a tool for testing female response to the unfamiliar lions whose manes varied by length (long or short) and color (blonde or dark). The female lions were observed to see whether they approached each of the four life-sized dummies. Complete parts (a) through (e) below. a. Identify the experimental units. Choose the correct answer below. The female lions The male dummies The mane colors The mane lengths Part 2 b. Identify the response variable. Choose the correct answer below. A. Whether or not (yes or no) the mane length affected how the female lions reacted to a male dummy. B. Whether or not (yes or no) the female lions approached the same dummies. C. Whether or not (yes or no) the female lions approached a male dummy. D. Whether or not…arrow_forward
- using Weierstrass app.arrow_forwardReAb. a question can influence eyewitness memory. In the study, college students watched a film of ap automobile accident and then were asked questions about what they saw. One group was asked, "About how fast were the cars going when they smashed into each other?" Another group was asked the same question except the verb was changed to "hit" in- stead of "smashed into." The "smashed into" group reported significantly higher estimates of speed than the "hit" group. Suppose a researcher repeats this study with a sample of today's college students and obtains the following results. Estimated Speed Smashed into Hit n 15 n = 15 M = 40.8 M = 34.0 SS = 510 SS = 414 a. Do the results indicate a significantly higher esti- mated speed for the "smashed into" group? Use a one-tailed test with a = .01. b. Compute the estimated value for Cohen's d to measure the size of the effect. the hypothesis test and the measure of effect size would appear in a research report. nort higher 18. In and a classicarrow_forwardChapter 6, Section 4-HT, Exercise 228 - MathPad Survival Status and Heart Rate in the ICUThe dataset ICUAdmissions contains information on a sample of 200 patients being admitted to the Intensive Care Unit (ICU) at a hospital. One of the variables is HeartRate and another is Statuswhich indicates whether the patient lived (Status=0) or died (Status=1). The computer output below shows the details of a test to determine whether mean heart rate is different between patients who lived and died. (You should not do any computations. State the hypotheses based on the output, read the p-value off the output, and state the conclusion). Two-sample T for HeartRate Status N Mean StDev SE Mean 0 160 98.5 27.0 2.1 1 40 100.6 26.5 4.2 Difference = μ (0) − μ (1) Estimate for difference: -2.12 95% CI for difference: (-11.53,7.28) T-Test of difference =0 (vs not = ): T-Value =-0.45 P-Value =0.653 DF =60Click here for the dataset associated with this question.…arrow_forward
- The migration pattern of Monarch butterflies are tracked by a catch-and-release method in which individual butterflies are tagged with a circular, lightweight sticker placed carefully on the wings so as not to impede their ability to fly. The sticker contains a unique ID number. Volunteers across the U.S. and South America capture the butterflies, record the IDs if they are tagged, and release them. This allows us to track the locations each unique ID is found, allowing us to estimate the migration pattern. On average, 1 out of 100 captured butterflies are already tagged. Suppose you are a volunteer and capture 50 butterflies; let X denote the number of those that are already tagged. What is the distribution of X? What is the probability that you catch at least one tagged butterfly?arrow_forwardSource: Centers for Disease Control and Prevention. [Vital Signs: binge Drinking among women and high school girls - United States 2011]. MMWR 2013;62:pg 9-13. http://www.cdc.gov/mmwr/pdf/wk/mm6201.pdf The article referenced says that when women aged 25-34 binge drink they have on average 7.2 drinks. I'm wondering if women in Laramie are different than the national average. Assume the standard deviation is 0.42 drinks. I sample 9 women who have done binge drinking, and their average is 5.1 drinks. Can I say at the 0.05 significance level that the average is not equal to 7.2? Hg:X = 7.2 HA:X + 7.2 Ho:x + 7.2 HAix = 7.2 Ho:u - 5.1 Ho: = 7.2 Họ:* 5.1 Ho:u + 7.2 HA 5.1 HA:H 7.2 HA:H - 5.1 HA:H - 7.2 P-value ODo not answer until you choose an a ODo not answer until you choose an a You cannot answer this until you choose an a O You cannot answer this until you choose an aarrow_forwardgiven this data, what will be the most appropriate way to present them?arrow_forward
- please help me with this study problem.arrow_forwardCalculate the MAPE for each of the 3 forecast models used in the table. Which should be used for forecasting efforts, and why?arrow_forwardWhich model—the one for parliaments or the one for ministries (or cabinets)—presented in the article has the greater explanatory power? How can you tell?arrow_forward
 Linear Algebra: A Modern IntroductionAlgebraISBN:9781285463247Author:David PoolePublisher:Cengage Learning
 Glencoe Algebra 1, Student Edition, 9780079039897...AlgebraISBN:9780079039897Author:CarterPublisher:McGraw Hill
 Big Ideas Math A Bridge To Success Algebra 1: Stu...AlgebraISBN:9781680331141Author:HOUGHTON MIFFLIN HARCOURTPublisher:Houghton Mifflin Harcourt