
Introductory Statistics (10th Edition)
10th Edition
ISBN: 9780321989178
Author: Neil A. Weiss
Publisher: PEARSON
expand_more
expand_more
format_list_bulleted
Concept explainers
Videos
Textbook Question
Chapter 2.4, Problem 151E
SnowGoose Nests. In the article “Trophic Interaction Cycles in Tundra Ecosystems and the Impact of Climate Change” (Bio- Science, Vol. 55, No. 4, pp. 311–321), R. Ims and E. Fuglei provided an overview of animal species in the northern tundra. One threat to the snow goose in arctic Canada is the lemming. Snowy owls act as protection to the snow goose breeding grounds. For two years that are 3 years apart, the following graphs give relative frequency histograms of the distances, in meters, of snow goose nests to the nearest snowy owl nest.
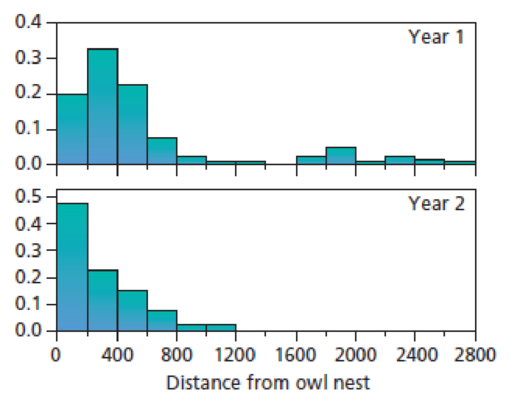
For each histogram, do the following:
- a. Identify the shape of the distribution with regard to modality.
- b. Identify the shape of the distribution with regard to symmetry (or nonsymmetry).
- c. If the distribution is unimodal and nonsymmetric, classify it as either right skewed or left skewed.
- d. Compare the two distributions.
Expert Solution & Answer
Want to see the full answer?
Check out a sample textbook solution
Students have asked these similar questions
SnowGoose Nests. In the article “Trophic Interaction Cycles in Tundra Ecosystems and the Impact of Climate Change” (Bio- Science, Vol. 55, No. 4, pp. 311–321), R. Ims and E. Fuglei provided an overview of animal species in the northern tundra. One threat to the snow goose in arctic Canada is the lemming. Snowy owls act as protection to the snow goose breeding grounds. For two years that are 3 years apart, the following graphs give relative frequency histograms of the distances, in meters, of snow goose nests to the nearest snowy owl nest.
For each histogram, do the following:
a. Identify the shape of the distribution with regard to modality.
b. Identify the shape of the distribution with regard to symmetry (or nonsymmetry).
c. If the distribution is unimodal and nonsymmetric, classify it as either right skewed or left skewed.
d. Compare the two distributions.
a.State the predictors available in this model.
find the end behavior model of question 1
Chapter 2 Solutions
Introductory Statistics (10th Edition)
Ch. 2.1 - Give an example, other than those presented in...Ch. 2.1 - Explain the meaning of a. qualitative variable. b....Ch. 2.1 - Explain the meaning of a. qualitative data. b....Ch. 2.1 - Provide a reason why the classification of data is...Ch. 2.1 - Of the variables you have studied so far, which...Ch. 2.1 - For each part of Exercises 2.62.11, classify the...Ch. 2.1 - Earthquakes. The U.S. Geological Survey monitors...Ch. 2.1 - Top 10 IPOs. An online article from the Washington...Ch. 2.1 - Earnings from the Crypt. On the Celebrity NetWorth...Ch. 2.1 - World University Rankings. The Times Higher...
Ch. 2.1 - Recording Industry Statistics. The Recording...Ch. 2.1 - RBI Kings. As reported on MLB.com, the five...Ch. 2.1 - Top Broadcast Shows. As reported in Primetime...Ch. 2.1 - The Fulbright Program. The U.S. governments...Ch. 2.1 - Top 10 Green Cars. The following table presents...Ch. 2.1 - Ordinal Data. Another important type of data is...Ch. 2.2 - What is a frequency distribution of qualitative...Ch. 2.2 - Explain the difference between a. frequency and...Ch. 2.2 - Answer true or false to each of the statements in...Ch. 2.2 - In Exercises 2.202.25, we have presented some...Ch. 2.2 - Prob. 21ECh. 2.2 - In Exercises 2.202.25, we have presented some...Ch. 2.2 - Prob. 23ECh. 2.2 - In Exercises 2.202.25, we have presented some...Ch. 2.2 - In Exercises 2.202.25, we have presented some...Ch. 2.2 - For each data set in Exercises 2.262.31, a....Ch. 2.2 - For each data set in Exercises 2.262.31, a....Ch. 2.2 - For each data set in Exercises 2.262.31, a....Ch. 2.2 - For each data set in Exercises 2.262.31, a....Ch. 2.2 - For each data set in Exercises 2.262.31, a....Ch. 2.2 - For each data set in Exercises 2.262.31, a....Ch. 2.2 - In each of Exercises 2.322.37, we have presented a...Ch. 2.2 - In each of Exercises 2.322.37, we have presented a...Ch. 2.2 - In each of Exercises 2.322.37, we have presented a...Ch. 2.2 - In each of Exercises 2.322.37, we have presented a...Ch. 2.2 - In each of Exercises 2.322.37, we have presented a...Ch. 2.2 - Prob. 37ECh. 2.2 - Health Status. The National Center for Health...Ch. 2.2 - In Exercises 2.392.41, use the technology of your...Ch. 2.2 - Prob. 40ECh. 2.2 - In Exercises 2.392.41, use the technology of your...Ch. 2.3 - Identify an important reason for grouping data.Ch. 2.3 - Do the concepts of class limits, marks, cutpoints,...Ch. 2.3 - State three of the most important guidelines in...Ch. 2.3 - With regard to grouping quantitative data into...Ch. 2.3 - For quantitative data, we examined three types of...Ch. 2.3 - We used slightly different methods for determining...Ch. 2.3 - Explain the difference between a frequency...Ch. 2.3 - Explain the advantages and disadvantages of...Ch. 2.3 - For data that are grouped in classes based on more...Ch. 2.3 - Discuss the relative advantages and disadvantages...Ch. 2.3 - Suppose that you have a data set that contains a...Ch. 2.3 - Suppose that you have constructed a stem-and-leaf...Ch. 2.3 - In each of Exercises 2.542.59, we have presented a...Ch. 2.3 - In each of Exercises 2.542.59, we have presented a...Ch. 2.3 - In each of Exercises 2.542.59, we have presented a...Ch. 2.3 - In each of Exercises 2.542.59, we have presented a...Ch. 2.3 - Prob. 58ECh. 2.3 - In each of Exercises 2.542.59, we have presented a...Ch. 2.3 - Prob. 60ECh. 2.3 - Prob. 61ECh. 2.3 - In Exercises 2.602.71, we have presented some...Ch. 2.3 - In Exercises 2.602.71, we have presented some...Ch. 2.3 - In Exercises 2.602.71, we have presented some...Ch. 2.3 - In Exercises 2.602.71, we have presented some...Ch. 2.3 - Prob. 66ECh. 2.3 - In Exercises 2.602.71, we have presented some...Ch. 2.3 - In Exercises 2.602.71, we have presented some...Ch. 2.3 - Prob. 69ECh. 2.3 - In Exercises 2.602.71, we have presented some...Ch. 2.3 - In Exercises 2.602.71, we have presented some...Ch. 2.3 - Prob. 72ECh. 2.3 - In each of Exercises 2.722.75, construct a dotplot...Ch. 2.3 - Prob. 74ECh. 2.3 - In each of Exercises 2.722.75, construct a dotplot...Ch. 2.3 - In each of Exercises 2.762.79, construct a...Ch. 2.3 - Prob. 77ECh. 2.3 - In each of Exercises 2.762.79, construct a...Ch. 2.3 - Prob. 79ECh. 2.3 - Prob. 80ECh. 2.3 - For each data set in Exercises 2.802.91, use the...Ch. 2.3 - For each data set in Exercises 2.802.91, use the...Ch. 2.3 - For each data set in Exercises 2.802.91, use the...Ch. 2.3 - For each data set in Exercises 2.802.91, use the...Ch. 2.3 - For each data set in Exercises 2.802.91, use the...Ch. 2.3 - For each data set in Exercises 2.802.91, use the...Ch. 2.3 - Prob. 87ECh. 2.3 - Prob. 88ECh. 2.3 - Prob. 89ECh. 2.3 - Prob. 90ECh. 2.3 - Prob. 91ECh. 2.3 - Prob. 92ECh. 2.3 - Age of Passenger Cars. According to R. L. Polk ...Ch. 2.3 - Stressed-Out Bus Drivers. Frustrated passengers,...Ch. 2.3 - Acute Postoperative Days. Several neurosurgeons...Ch. 2.3 - MMs. In the article Sweetening StatisticsWhat MMs...Ch. 2.3 - Women in the Workforce. In an issue of Science...Ch. 2.3 - Process Capability. R. Morris and E. Watson...Ch. 2.3 - University Patents. The number of patents a...Ch. 2.3 - Prob. 100ECh. 2.3 - Prob. 101ECh. 2.3 - Adjusted Gross Incomes. The Internal Revenue...Ch. 2.3 - Cholesterol Levels. According to the National...Ch. 2.3 - Hospital Beds. The number of hospital beds...Ch. 2.3 - Parkinsons Disease. Parkinsons disease affects...Ch. 2.3 - The Great White Shark. In an article titled Great...Ch. 2.3 - The Beatles. In the article, Length of The Beatles...Ch. 2.3 - High School Completion. As reported by the U.S....Ch. 2.3 - Prob. 109ECh. 2.3 - Body Temperature. A study by researchers at the...Ch. 2.3 - Exam Scores. The exam scores for the students in...Ch. 2.3 - Prob. 112ECh. 2.3 - Prob. 113ECh. 2.3 - Age and Gender. The following bivariate data on...Ch. 2.3 - Prob. 115ECh. 2.3 - Clocking the Cheetah. Construct a...Ch. 2.3 - Prob. 117ECh. 2.3 - Residential Energy Consumption. Refer to the...Ch. 2.3 - Prob. 119ECh. 2.3 - Cardiovascular Hospitalizations. The Florida State...Ch. 2.3 - Prob. 121ECh. 2.4 - In each of Exercises 2.1222.127, explain the...Ch. 2.4 - In each of Exercises 2.1222.127, explain the...Ch. 2.4 - In each of Exercises 2.1222.127, explain the...Ch. 2.4 - Prob. 125ECh. 2.4 - Prob. 126ECh. 2.4 - Prob. 127ECh. 2.4 - Prob. 128ECh. 2.4 - Suppose that a variable of a population has a...Ch. 2.4 - Prob. 130ECh. 2.4 - Identify and sketch three distribution shapes that...Ch. 2.4 - Prob. 132ECh. 2.4 - In each of Exercises 2.1322.139, we have drawn a...Ch. 2.4 - In each of Exercises 2.1322.139, we have drawn a...Ch. 2.4 - In each of Exercises 2.1322.139, we have drawn a...Ch. 2.4 - In each of Exercises 2.1322.139, we have drawn a...Ch. 2.4 - In each of Exercises 2.1322.139, we have drawn a...Ch. 2.4 - In each of Exercises 2.1322.139, we have drawn a...Ch. 2.4 - Prob. 139ECh. 2.4 - In each of Exercises 2.1402.149, we have provided...Ch. 2.4 - In each of Exercises 2.1402.149, we have provided...Ch. 2.4 - Prob. 142ECh. 2.4 - In each of Exercises 2.1402.149, we have provided...Ch. 2.4 - In each of Exercises 2.1402.149, we have provided...Ch. 2.4 - In each of Exercises 2.1402.149, we have provided...Ch. 2.4 - In each of Exercises 2.1402.149, we have provided...Ch. 2.4 - Prob. 147ECh. 2.4 - Prob. 148ECh. 2.4 - Prob. 149ECh. 2.4 - Old Faithful. Old Faithful is a geyser in...Ch. 2.4 - SnowGoose Nests. In the article Trophic...Ch. 2.4 - Prob. 152ECh. 2.4 - In each of Exercises 2.1522.157, a. use the...Ch. 2.4 - In each of Exercises 2.1522.157, a. use the...Ch. 2.4 - Prob. 155ECh. 2.4 - In each of Exercises 2.1522.157, a. use the...Ch. 2.4 - In each of Exercises 2.1522.157, a. use the...Ch. 2.4 - Standard Normal Distribution. One of the most...Ch. 2.5 - Give one reason why constructing and reading...Ch. 2.5 - Prob. 163ECh. 2.5 - Reading Skills. Each year the director of the...Ch. 2.5 - Americas Melting Pot. The U.S. Census Bureau...Ch. 2.5 - Prob. 167ECh. 2.5 - Drunk-Driving Fatalities. Drunk-driving fatalities...Ch. 2.5 - Prob. 169ECh. 2.5 - Prob. 170ECh. 2.5 - Prob. 171ECh. 2 - This problem is about variables. a. What is a...Ch. 2 - This problem is about data. a. What are data? b....Ch. 2 - For a qualitative data set, what is a a. frequency...Ch. 2 - What is the relationship between a frequency or...Ch. 2 - Identify two main types of graphical displays that...Ch. 2 - In a bar chart, unlike in a histogram, the bars do...Ch. 2 - Some users of statistics prefer pie charts to bar...Ch. 2 - When is the use of single-value grouping...Ch. 2 - A quantitative data set has been grouped by using...Ch. 2 - A quantitative data set has been grouped by using...Ch. 2 - A quantitative data set has been grouped by using...Ch. 2 - A quantitative data set has been grouped by using...Ch. 2 - Explain the relative positioning of the bars in a...Ch. 2 - Sketch the curve corresponding to each of the...Ch. 2 - Draw a smooth curve that represents a symmetric...Ch. 2 - Prob. 16RPCh. 2 - Largest Hydroelectric Plants. According to...Ch. 2 - DVD Players. Refer to Example 2.16 on page 60. a....Ch. 2 - Inauguration Ages. From the Information Please...Ch. 2 - Inauguration Ages. Refer to Problem 19. Construct...Ch. 2 - Prob. 21RPCh. 2 - Prob. 22RPCh. 2 - Busy Bank Tellers. The Prescott National Bank has...Ch. 2 - On-Time Arrivals. The Air Travel Consumer Report...Ch. 2 - Old Ballplayers. From the ESPN Web site, we...Ch. 2 - Prob. 26RPCh. 2 - U.S. Divisions. The U.S. Census Bureau divides the...Ch. 2 - Prob. 28RPCh. 2 - Prob. 29RPCh. 2 - Hair and Eye Color. In the article Graphical...Ch. 2 - Prob. 31RPCh. 2 - In Problems 3133, a. identify the population and...Ch. 2 - In Problems 3133, a. identify the population and...Ch. 2 - UWEC UNDERGRADUATES Recall from Chapter 1 (see...Ch. 2 - Recall that, each year, Forbes magazine publishes...
Knowledge Booster


Learn more about
Need a deep-dive on the concept behind this application? Look no further. Learn more about this topic, statistics and related others by exploring similar questions and additional content below.Similar questions
- Define A Competitive-Hunter Model ?arrow_forwardThe Great White Shark. In an article titled “Great White, Deep Trouble” (National Geographic, Vol. 197(4), pp. 2–29), Peter Benchley—the author of JAWS—discussed various aspects of the Great White Shark (Carcharodon carcharias). Data on the number of pups borne in a lifetime by each of 80 Great White Shark females are provided on the WeissStats site. Use the technology of your choice to a. obtain frequency and relative-frequency distributions, using single-value grouping. b. construct and interpret either a frequency histogram or a relativefrequency histogram.arrow_forwardIn a study, the effects of the mane of a male lion as a signal of quality to mates and rivals was explored. Four life-sized dummies of male lions provided a tool for testing female response to the unfamiliar lions whose manes varied by length (long or short) and color (blonde or dark). The female lions were observed to see whether they approached each of the four life-sized dummies. Complete parts (a) through (e) below. a. Identify the experimental units. Choose the correct answer below. The female lions The male dummies The mane colors The mane lengths Part 2 b. Identify the response variable. Choose the correct answer below. A. Whether or not (yes or no) the mane length affected how the female lions reacted to a male dummy. B. Whether or not (yes or no) the female lions approached the same dummies. C. Whether or not (yes or no) the female lions approached a male dummy. D. Whether or not…arrow_forward
- Section 9.1 Question #7 Rhino viruses typically cause common colds. In a test of the effectiveness of echinacea, 35 of the 42 subjects treated with echinacea developed rhinovirus infections. In a placebo group, 85 of the 99 subjects developed rhinovirus infections. Use a 0.05 significance level to test the claim that echinacea has an effect on rhinovirus infections. Complete parts (a) through (c) below. a. Test the claim using a hypothesis test. Consider the first sample to be the sample of subjects treated with echinacea and the second sample to be the sample of subjects treated with a placebo. What are the null and alternative hypotheses for the hypothesis test? A. H0: p1 = p2 H1: p1 > p2 B. H0: p1 ≠ p2 H1: p1 = p2 C. H0: p1 ≤ p2 H1: p1 ≠ p2 D. H0: p1 = p2 H1: p1 < p2 E. H0: p1 = p2 H1: p1 ≠ p2 F. H0: p1 ≥ p2 H1: p1 ≠ p2 Identify the test statistic. z= ____________ (Round to two decimal places as needed.) Identify the…arrow_forwardAppalachian Bear Rescue (ABR) is a not-for-profit organization located near the Great Smoky Mountains National Park. ABR's programs include the rehabilitation of orphaned and injured black bears, as well as research and education about Appalachian black bears. ABR provides the most natural environment possible for rehabilitating black bears before their release back into the wild. Recently, Katie Settlage performed a study to learn more about the Appalachian black bear population in the Great Smoky Mountains National Park. She and a team of researchers found 68 black bears in the park and took measurements such as paw size, weight, and shoulder height. The stem-and-leaf plots below show the shoulder heights (in centimeters) of the 40 male and 28 female bears from the study. Shoulder Heights (in cm) of Male Bears Shoulder Heights (in cm) of Female Bears 4 9 Key: 4 9 = 49 Key: 5|0 = 50 5 7 8 9 71 1 2 2 2 2 2 3 3 3 4 4 5 5 6 6 788 8 123 4 4 5 6 79 90 0 3 6 79 7 8 1 2 3 3 3 33 4 6 7 555 5…arrow_forwardWhich model—the one for parliaments or the one for ministries (or cabinets)—presented in the article has the greater explanatory power? How can you tell?arrow_forward
- Wing Length. D. Cristol et al. published results of their studies of two subspecies of dark-eyed juncos in the paper “Migratory Dark-Eyed Juncos, Junco hyemalis, Have Better Spatial Memory and Denser Hippocampal Neurons Than Nonmigratory Conspecifics” (Animal Behaviour, Vol. 66, Issue 2, pp. 317–328). One of the subspecies migrates each year, and the other does not migrate. A hypothesis test is to be performed to decide whether the mean wing lengths for the two subspecies (migratory and nonmigratory) are different. a. identify the variable. b. identify the two populations. c. determine the null and alternative hypotheses. d. classify the hypothesis test as two tailed, left tailed, or right tailed.arrow_forward3. A housewife wanted to know which soil is best for her pechay plants: the soil purchased from an online seller, soil from her backyard compost or the soil underneath the nearby bamboo tree. She planted 30 pechay seeds into each soil source and then compared the growth of pechay after a month. Independent variable: Dependent variable: Extraneous variable: 4. Jenny is only borrowing the cellphone chargers of her brother, sister and mother because she lost her phone charger. All chargers are of the same specifications as hers even though they have different phone brands. However, she would like to know which charger and charging cable combination would fill her phone battery the fastest. She used the following codes as her reference and charged her phone uninterrupted using the following combination. The charging time of the phone was then compared. Brother's Charger: BB Brother's Cable: bb Sister's Charger: SS Sister's Cable: ss Mother's Charger: MM Mother's Cable: mm Combination…arrow_forward1. (Prob. 11-12, p. 438) An article in the Journal of Environmental Engineering (1989, Vol. 115(3), pp. 608–619) reported the results of a study on the occurrence of sodium and chloride in surface streams in central Rhode Island. The following data are chloride concentration y (in milligrams per liter) and roadway area in the watershed x (in percentage). y 4.4 6.6 9.7 10.6 10.8 10.9 0.19 0.15 0.57 0.70 0.67 0.63 y 11.8 12.1 14.3 14.7 15.0 17.3 0.47 0.70 0.60 0.78 0.81 0.78 y 19.2 23.1 27.4 27.7 31.8 39.5 0.69 1.30 1.05 1.06 1.74 1.62 a. Draw a scatter diagram of the data. Does a simple linear regression model seem appropriate here? b. Fit the simple linear regression model using the method of least squares. Find an estimate of o?. C. Estimate the mean chloride concentration for a watershed that has 1% roadway area. d. Find the fitted value corresponding to x = 0.47 and the associated residual.arrow_forward
- Exotic Plants. In the article “Effects of Human Population, Area, and Time on Non-native Plant and Fish Diversity in the United States” (Biological Conservation, Vol. 100, No. 2, pp. 243–252), M. McKinney investigated the relationship of various factors on the number of exotic plants in each state. On theWeissStats site, you will find the data on population (in millions), area (in thousands of square miles), and number of exotic plants for each state. Use the technology of your choice to determine the linear correlation coefficient between each of the following: a. population and area b. population and number of exotic plants c. area and number of exotic plants d. Interpret and explain the results you got in parts (a)–(c).arrow_forward(a) Identify the population of interest and the sample in this study. (b) Comment on whether or not the results of the study can be generalized to the population, and if the findings of the study can be used to establish causal relationships.arrow_forwardGround Water. The U.S. Geological Survey, in cooperation with the Florida Department of Environmental Protection, investigated the effects of waste disposal practices on ground water quality at five poultry farms in north-central Florida. At one site, they drilled four monitoring wells, numbered 1, 2, 3, and 4. Over a period of 9 months, water samples were collected from the last three wells and analyzed for a variety of chemicals, including potassium, chlorides, nitrates, and phosphorus. The concentrations, in milligrams per liter, are provided on the WeissStats site. For each of the four chemicals, decide whether the data provide sufficient evidence to conclude that a difference exists in mean concentration among the three wells. Use α = 0.01. [SOURCE: USGS Water Resources Investigations Report 95-4064, Effects of Waste-Disposal Practices on Ground- Water Quality at Five Poultry (Broiler) Farms in North-Central Florida, H. Hatzell, U.S. Geological Survey] a. conduct a one-way ANOVA…arrow_forward
arrow_back_ios
SEE MORE QUESTIONS
arrow_forward_ios
Recommended textbooks for you
 MATLAB: An Introduction with ApplicationsStatisticsISBN:9781119256830Author:Amos GilatPublisher:John Wiley & Sons Inc
 Probability and Statistics for Engineering and th...StatisticsISBN:9781305251809Author:Jay L. DevorePublisher:Cengage Learning
 Statistics for The Behavioral Sciences (MindTap C...StatisticsISBN:9781305504912Author:Frederick J Gravetter, Larry B. WallnauPublisher:Cengage Learning
 Elementary Statistics: Picturing the World (7th E...StatisticsISBN:9780134683416Author:Ron Larson, Betsy FarberPublisher:PEARSON
 The Basic Practice of StatisticsStatisticsISBN:9781319042578Author:David S. Moore, William I. Notz, Michael A. FlignerPublisher:W. H. Freeman
 Introduction to the Practice of StatisticsStatisticsISBN:9781319013387Author:David S. Moore, George P. McCabe, Bruce A. CraigPublisher:W. H. Freeman
MATLAB: An Introduction with Applications
Statistics
ISBN:9781119256830
Author:Amos Gilat
Publisher:John Wiley & Sons Inc
Probability and Statistics for Engineering and th...
Statistics
ISBN:9781305251809
Author:Jay L. Devore
Publisher:Cengage Learning
Statistics for The Behavioral Sciences (MindTap C...
Statistics
ISBN:9781305504912
Author:Frederick J Gravetter, Larry B. Wallnau
Publisher:Cengage Learning
Elementary Statistics: Picturing the World (7th E...
Statistics
ISBN:9780134683416
Author:Ron Larson, Betsy Farber
Publisher:PEARSON
The Basic Practice of Statistics
Statistics
ISBN:9781319042578
Author:David S. Moore, William I. Notz, Michael A. Fligner
Publisher:W. H. Freeman
Introduction to the Practice of Statistics
Statistics
ISBN:9781319013387
Author:David S. Moore, George P. McCabe, Bruce A. Craig
Publisher:W. H. Freeman
Hypothesis Testing - Solving Problems With Proportions; Author: The Organic Chemistry Tutor;https://www.youtube.com/watch?v=76VruarGn2Q;License: Standard YouTube License, CC-BY
Hypothesis Testing and Confidence Intervals (FRM Part 1 – Book 2 – Chapter 5); Author: Analystprep;https://www.youtube.com/watch?v=vth3yZIUlGQ;License: Standard YouTube License, CC-BY