
Videos
a.
Construct the percent frequency distribution of field of study for the various degrees.
a.
Answer to Problem 9E
The percent frequency distribution for bachelor’s degree is as follows:
| Bachelor’s degree | Percent frequency |
| B | 21% |
| CSE | 9% |
| E | 6% |
| H | 16% |
| NSM | 8% |
| O | 24% |
| SBS | 16% |
The percent frequency distribution for Master’s degree is as follows:
| Master’s degree | Percent frequency |
| B | 27% |
| CSE | 9% |
| E | 24% |
| H | 8% |
| NSM | 2% |
| O | 24% |
| SBS | 6% |
Explanation of Solution
Calculation:
The fields of studies in which a bachelor’s degrees and a master’s degree are provided, are given for a sample of 100 graduates. The respective categories are Business (B), Computer science and Engineering (CSE), Education (E), Natural sciences and Mathematics (NSM), Social and Behavioral sciences (SBS) and Other (O).
For Bachelor’s degree:
Frequency:
The frequencies are calculated by using the tally mark. Here, the number of times each class repeats is the frequency of that particular class.
Here, “B” is the category, which is repeated for 21 times in the data set and thus, 21 is the frequency for the category B.
Similarly, the frequencies of the remaining categories are given below:
| Bachelor’s degree | Tally | Frequency |
| B | 21 | |
| CSE | 9 | |
| E | 6 | |
| H | 16 | |
| NSM | 8 | |
| O | 24 | |
| SBS | 16 | |
| Total | 100 |
Relative frequency:
The general formula for the relative frequency is,
Therefore,
Similarly, the relative frequencies for the remaining types of classes are obtained below:
| Bachelor’s degree | Frequency | Relative frequency |
| B | 21 | |
| CSE | 9 | |
| E | 6 | |
| H | 16 | |
| NSM | 8 | |
| O | 24 | |
| SBS | 16 | |
| Total | 100 |
Percentage frequency distribution:
The general formula for the percent frequency is,
Therefore,
The percent frequencies for the remaining types of categories of education fields for Bachelor’s degree are obtained below:
| Bachelor’s degree | Relative frequency | Percent frequency |
| B | 0.21 | 21% |
| CSE | 0.09 | 9% |
| E | 0.06 | 6% |
| H | 0.16 | 16% |
| NSM | 0.08 | 8% |
| O | 0.24 | 24% |
| SBS | 0.16 | 16% |
| Total | 1.00 | 100 |
For Master’s degree:
Here, “B” is the department, which is repeated for 27 times in the data set and thus, 27 is the frequency for the category business (B).
Similarly, the frequencies of remaining types of departments are given below:
| Master’s degree | Tally | Frequency |
| B | 27 | |
| CSE | 9 | |
| E | 24 | |
| H | 8 | |
| NSM | 2 | |
| O | 24 | |
| SBS | 6 | |
| Total | 100 |
Relative frequency:
Similarly, the relative frequencies for the remaining types of classes (PPG) are obtained below:
| Master’s degree | Frequency | Relative frequency |
| B | 27 | |
| CSE | 9 | |
| E | 24 | |
| H | 8 | |
| NSM | 2 | |
| O | 24 | |
| SBS | 6 | |
| Total | 100 |
Percentage frequency distribution:
The percent frequencies for the remaining types of categories of education fields for Master’s degree are obtained below:
| Master’s degree | Relative Frequency | Percent frequency |
| B | 0.27 | 27% |
| CSE | 0.09 | 9% |
| E | 0.24 | 24% |
| H | 0.08 | 8% |
| NSM | 0.02 | 2% |
| O | 0.24 | 24% |
| SBS | 0.06 | 6% |
| Total | 1.00 | 100 |
b.
Construct the bar charts for the two degrees.
b.
Answer to Problem 9E
- The bar chart for Bachelor’s degree is given below:
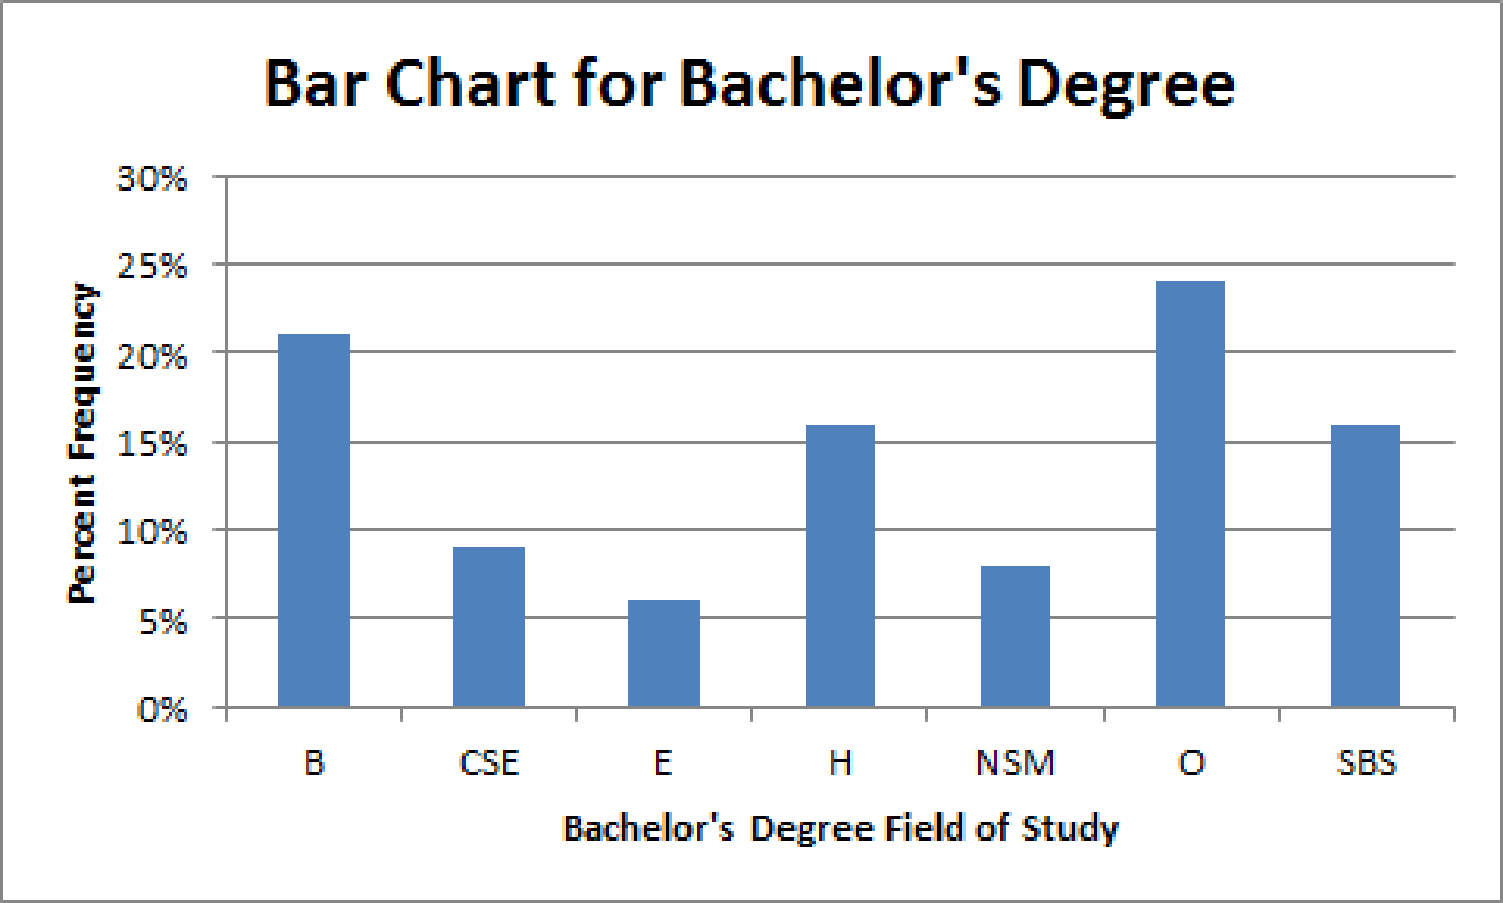
- The bar chart for Bachelor’s degree is given below:
Explanation of Solution
Calculation:
The bar charts can be obtained using software.
Bachelor’s degree:
Software procedure:
Step-by-step procedure to draw the bar chart using EXCEL software:
- Open an EXCEL sheet.
- Enter the fields of study in Bachelor’s degree and the corresponding frequencies in columns A and B respectively, under the headings of Bachelor’s degree in cell A1 and Percent Frequency in cell B1.
- Select the entered data along with the headings.
- Choose Insert > Column > 2-D Column > Clustered Column.
- Choose Layout > Chart Title > Above Chart and enter Bar Chart for Bachelor’s Degree.
- Choose Layout > Axis Title > Primary Horizontal Axis Title > Title Below Axis and enter Bachelor’s Degree Field of Study.
- Choose Layout > Axis Title > Primary Vertical Axis Title > Rotated Title and enter Percent Frequency.
Hence, the bar chart for the Bachelor’s degree data is obtained using EXCEL software.
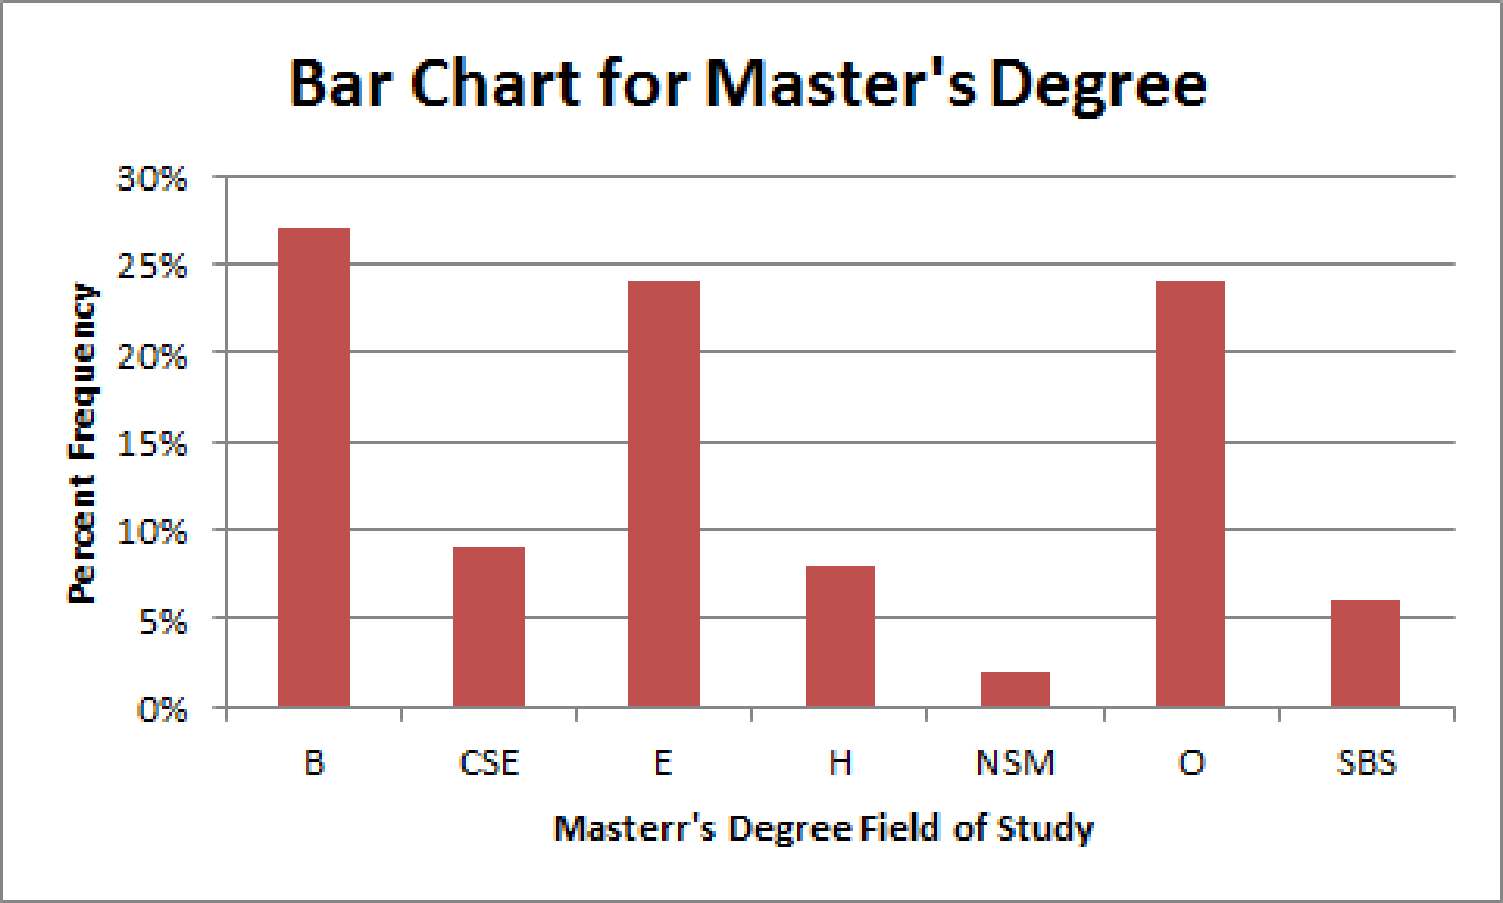
- Master’s degree:
Software procedure:
Step-by-step procedure to draw the bar chart using EXCEL software:
- Open an EXCEL sheet.
- Enter the fields of study in Master’s degree and the corresponding frequencies in columns A and B respectively, under the headings of Master’s degree in cell A1 and Percent Frequency in cell B1.
- Select the entered data along with the headings.
- Choose Insert > Column > 2-D Column > Clustered Column.
- Choose Layout > Chart Title > Above Chart and enter Bar Chart for Master’s Degree.
- Choose Layout > Axis Title > Primary Horizontal Axis Title > Title Below Axis and enter Master’s Degree Field of Study.
- Choose Layout > Axis Title > Primary Vertical Axis Title > Rotated Title and enter Percent Frequency.
Hence, the bar chart for the Master’s degree data is obtained using EXCEL software.
c.
Find the lowest percentage field of study for each degree.
c.
Answer to Problem 9E
The lowest percentage field of study for a Bachelor’ degree is Education.
The lowest percentage field of study for a Master’s degree is Natural science and Mathematics.
Explanation of Solution
From the percent frequencies in Part a, it is found that for Bachelor’ degree, the percentage for Education (E) is 6%, which is the lowest when compared to the other categories.
For Master’s degree, the percentage for Natural science and Mathematics (NSM) is 2%, which is the lowest when compared to the other categories.
d.
Find the highest percentage field of study for each degree.
d.
Answer to Problem 9E
The highest percentage field of study for a Bachelor’ degree is Others.
The highest percentage field of study for a Master’s degree is Business.
Explanation of Solution
From the percent frequencies in Part a, it is found that for the Other (O) category, the percentage is 24%, which is the highest when compared to the other categories.
For Master’s degree, the percentage for Business (B) is 27%, which is the highest when compared to the other categories.
e.
Identify the field of study that has the largest increase in percentage from bachelor’s to masters’.
e.
Answer to Problem 9E
The field of study Education has the largest increase in percentage from bachelor’s to masters’.
Explanation of Solution
Calculation:
In order to the obtain the study field that has the largest increase in percentage from bachelor’s to Masters’ is calculated by obtaining the difference between two respective percentages.
Therefore,
The differences between two fields are tabulated below:
| Field | Bachelor’s | Master’s | Difference (Master’s – Bachelor’s) |
| B | 21% | 27% | (27 – 21)% = 6% |
| CSE | 9% | 9% | (9 – 9)% = 0% |
| E | 6% | 24% | (24 – 6)% = 18% |
| H | 16% | 8% | (8 – 16)% = –8% |
| NSM | 8% | 2% | (2 – 8)% = –6% |
| O | 24% | 24% | (24 – 24)% = 0% |
| SBS | 16% | 6% | (6 – 16)% = –10% |
From the table, it is observed that the field of study Education has the largest increase in percentage (6%) from bachelor’s to masters’ degree.
Want to see more full solutions like this?
Chapter 2 Solutions
Bundle: Modern Business Statistics with Microsoft Office Excel, Loose-Leaf Version, 6th + MindTap Business Statistics, 2 terms (12 months) Printed Access Card


 Glencoe Algebra 1, Student Edition, 9780079039897...AlgebraISBN:9780079039897Author:CarterPublisher:McGraw Hill
 Big Ideas Math A Bridge To Success Algebra 1: Stu...AlgebraISBN:9781680331141Author:HOUGHTON MIFFLIN HARCOURTPublisher:Houghton Mifflin Harcourt