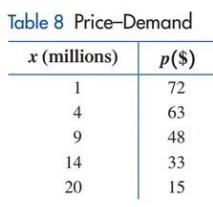
Price-demand. A company manufactures memory chips for microcomputers. Its marketing research department, using statistical techniques, collected the data shown in Table 8 , where p is the wholesale price per chip at which x million chips can be sold. Using special analytical techniques (regression analysis), an analyst produced the following price demand function to model the data: p x = 75 − 3 x 1 ≤ x ≤ 20 (a) Plot the data points in Table 8 , and sketch a graph of the price-demand function in the same coordinate system . (b) What would be the estimated price per chip for a demand of 7 million chips? For a demand of 11 million chips?
Price-demand. A company manufactures memory chips for microcomputers. Its marketing research department, using statistical techniques, collected the data shown in Table 8 , where p is the wholesale price per chip at which x million chips can be sold. Using special analytical techniques (regression analysis), an analyst produced the following price demand function to model the data: p x = 75 − 3 x 1 ≤ x ≤ 20 (a) Plot the data points in Table 8 , and sketch a graph of the price-demand function in the same coordinate system . (b) What would be the estimated price per chip for a demand of 7 million chips? For a demand of 11 million chips?
Price-demand. A company manufactures memory chips for microcomputers. Its marketing research department, using statistical techniques, collected the data shown in Table
8
, where
p
is the wholesale price per chip at which
x
million chips can be sold. Using special analytical techniques (regression analysis), an analyst produced the following price demand function to model the data:
p
x
=
75
−
3
x
1
≤
x
≤
20
(a) Plot the data points in Table
8
, and sketch a graph of the price-demand function in the same coordinate system.
(b) What would be the estimated price per chip for a demand of
7
million chips? For a demand of
11
million chips?
System that uses coordinates to uniquely determine the position of points. The most common coordinate system is the Cartesian system, where points are given by distance along a horizontal x-axis and vertical y-axis from the origin. A polar coordinate system locates a point by its direction relative to a reference direction and its distance from a given point. In three dimensions, it leads to cylindrical and spherical coordinates.
Finite Mathematics & Its Applications (12th Edition)
Knowledge Booster
Learn more about
Need a deep-dive on the concept behind this application? Look no further. Learn more about this topic, subject and related others by exploring similar questions and additional content below.
Time Series Analysis Theory & Uni-variate Forecasting Techniques; Author: Analytics University;https://www.youtube.com/watch?v=_X5q9FYLGxM;License: Standard YouTube License, CC-BY


 Algebra & Trigonometry with Analytic GeometryAlgebraISBN:9781133382119Author:SwokowskiPublisher:Cengage
 Glencoe Algebra 1, Student Edition, 9780079039897...AlgebraISBN:9780079039897Author:CarterPublisher:McGraw Hill
 Elementary AlgebraAlgebraISBN:9780998625713Author:Lynn Marecek, MaryAnne Anthony-SmithPublisher:OpenStax - Rice University
 Functions and Change: A Modeling Approach to Coll...AlgebraISBN:9781337111348Author:Bruce Crauder, Benny Evans, Alan NoellPublisher:Cengage Learning