
Elementary Technical Mathematics
12th Edition
ISBN: 9781337630580
Author: Dale Ewen
Publisher: Cengage Learning
expand_more
expand_more
format_list_bulleted
Videos
Textbook Question
Chapter 15.3, Problem 10E
A hygrothermograph is used by the weather services to record temperature and relative humidity (see Illustration 5). The lower part of the graph is used to measure relative humidity from 0% to 100%. The upper part of the graph is used to measure temperature from
F to
F. For example, at 8:00 P.M., the temperature was
F, and the relative humidity was 82%.
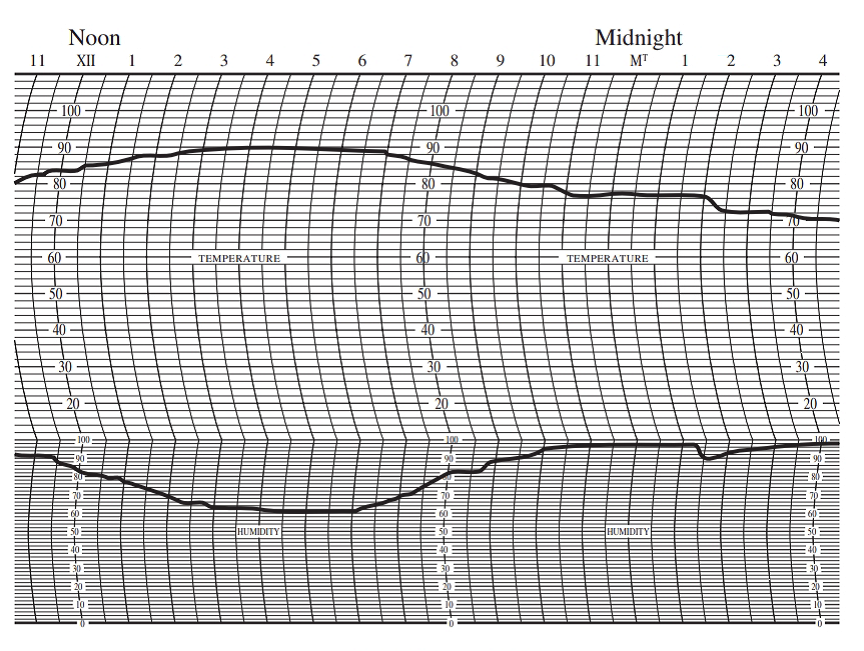
ILLUSTRATION 5
Hygrothermography (temperature in
Use the hygrothermograph in Illustration 5 to answer Exercises 9–14.
What was the temperature at 3:30 A.M.?
Expert Solution & Answer
Want to see the full answer?
Check out a sample textbook solution
Students have asked these similar questions
This sketch is from a study showing the influence of surface temperature (in °C) on air currents.
800
600
400
Primary
urban
layer
200
SW
-12.8 °C
-11.9 °С -15.6 °С-12.9 0С -11.5 °С -17.3 оС
Surface temperature
Part 1 out of 2
a. What is the highest surface temperature on this graph?
°C
Height (m)
What would the amplitude, period, and midline y values be using this given graph?
Illustration 8,5. Table 8.5 gives the highest and lowest prices of
silver during the period 1962-69. Plot these as a graph.
TABLE 8.5. PRICES OF SILVER-BOMBAY (Rs per kilogram)
Highest
Lowest
1962-63
242
187
1963-64
269
222
1964-65
281
244
1965-66
406
281
1966-67
385
336
1967-68
565
346
1968-69
633
508
Chapter 15 Solutions
Elementary Technical Mathematics
Ch. 15.1 - Find the approximate annual earnings of each of...Ch. 15.1 - Find the approximate annual earnings of each of...Ch. 15.1 - Find the approximate annual earnings of each of...Ch. 15.1 - Find the approximate annual earnings of each of...Ch. 15.1 - Find the approximate annual earnings of each of...Ch. 15.1 - Find the approximate annual earnings of each of...Ch. 15.1 - Find the approximate annual earnings of each of...Ch. 15.1 - Find the approximate annual earnings of each of...Ch. 15.1 - Find the approximate annual earnings of each of...Ch. 15.1 - Find the approximate annual earnings of each of...
Ch. 15.1 - Find the following information from Illustration...Ch. 15.1 - Find the following information from Illustration...Ch. 15.1 - Find the following information from Illustration...Ch. 15.1 - Find the following information from Illustration...Ch. 15.1 - Find the following information from Illustration...Ch. 15.1 - Find the following information from Illustration...Ch. 15.1 - Find the following information from Illustration...Ch. 15.1 - Find the following information from Illustration...Ch. 15.1 - Find the following information from Illustration...Ch. 15.1 - Find the following information from Illustration...Ch. 15.1 - A survey of 100 families was taken to find the...Ch. 15.1 - Illustration 3 shows the average text scores on...Ch. 15.1 - Prob. 23ECh. 15.1 - Prob. 24ECh. 15.1 - Prob. 25ECh. 15.2 - Find 26% of 360.Ch. 15.2 - Find 52% of 360Ch. 15.2 - Prob. 3ECh. 15.2 - Find 37.1% of 360Ch. 15.2 - Prob. 5ECh. 15.2 - Find 47.7% of 360Ch. 15.2 - Of 744 students, 452 are taking mathematics. What...Ch. 15.2 - Of 2017 students, 189 are taking technical...Ch. 15.2 - Prob. 9ECh. 15.2 - Candidate A was one of four candidates in an...Ch. 15.2 - A department spends $16,192 of its $182,100 budget...Ch. 15.2 - In June, the sales of an automobile dealership...Ch. 15.2 - Draw a circle graph for Exercises 1320: United...Ch. 15.2 - United States estimated population by age in 2016:...Ch. 15.2 - The suggested semester credit-hour requirements...Ch. 15.2 - A company interviewed its 473 employees to find...Ch. 15.2 - Total forest by continent in year 2015 in millions...Ch. 15.2 - The highest level of education for persons age 25...Ch. 15.2 - Prob. 19ECh. 15.2 - Some 2030 United Nations projected population data...Ch. 15.3 - The data in Illustration 1 are from the records of...Ch. 15.3 - An inspector recorded the number of faulty...Ch. 15.3 - Illustration 3 lists the 6months sales performance...Ch. 15.3 - A technician is often asked to read graphs drawn...Ch. 15.3 - A technician is often asked to read graphs drawn...Ch. 15.3 - A technician is often asked to read graphs drawn...Ch. 15.3 - A technician is often asked to read graphs drawn...Ch. 15.3 - A technician is often asked to read graphs drawn...Ch. 15.3 - A hygrothermograph is used by the weather services...Ch. 15.3 - A hygrothermograph is used by the weather services...Ch. 15.3 - Prob. 11ECh. 15.3 - A hygrothermograph is used by the weather services...Ch. 15.3 - A hygrothermograph is used by the weather services...Ch. 15.3 - A hygrothermograph is used by the weather services...Ch. 15.3 - According to National Oceanic and Atmospheric...Ch. 15.4 - Use Figure 15.6 to find the answers for Exercises...Ch. 15.4 - Use Figure 15.6 to find the answers for Exercises...Ch. 15.4 - Use Figure 15.6 to find the answers for Exercises...Ch. 15.4 - Use Figure 15.6 to find the answers for Exercises...Ch. 15.4 - Use Figure 15.6 to find the answers for Exercises...Ch. 15.4 - Use Figure 15.7 to find the answers for Exercises...Ch. 15.4 - Use Figure 15.7 to find the answers for Exercises...Ch. 15.4 - Use Figure 15.7 to find the answers for Exercises...Ch. 15.4 - Prob. 9ECh. 15.4 - Prob. 10ECh. 15.5 - Find the mean measurement for each set of...Ch. 15.5 - Find the mean measurement for each set of...Ch. 15.5 - Prob. 3ECh. 15.5 - Find the mean measurement for each set of...Ch. 15.5 - Prob. 5ECh. 15.5 - Find the mean measurement for each set of...Ch. 15.5 - Prob. 7ECh. 15.5 - Find the mean measurement for each set of...Ch. 15.5 - Prob. 9ECh. 15.5 - Find the mean measurement for each set of...Ch. 15.5 - Prob. 11ECh. 15.5 - Find the mean measurement for each set of...Ch. 15.5 - Find the mean measurement for each set of...Ch. 15.5 - Find the mean measurement for each set of...Ch. 15.5 - The mileage on six vehicles leased for 1 year was...Ch. 15.5 - A trucking company had hauls of 2018 km, 2101 km,...Ch. 15.5 - Over an 8day period of time the high temperature...Ch. 15.5 - A pharmacist weighed ten different capsules of the...Ch. 15.5 - A technician measured the power usage of six...Ch. 15.5 - A trucking company had seven items with the...Ch. 15.5 - According to the U.S. Energy Information...Ch. 15.5 - As trees grow in diameter, the wood produced in...Ch. 15.6 - 120. Find the median measurement for each set of...Ch. 15.6 - 120. Find the median measurement for each set of...Ch. 15.6 - Prob. 3ECh. 15.6 - 120. Find the median measurement for each set of...Ch. 15.6 - Prob. 5ECh. 15.6 - 120. Find the median measurement for each set of...Ch. 15.6 - Prob. 7ECh. 15.6 - 120. Find the median measurement for each set of...Ch. 15.6 - Prob. 9ECh. 15.6 - 120. Find the median measurement for each set of...Ch. 15.6 - Prob. 11ECh. 15.6 - 120. Find the median measurement for each set of...Ch. 15.6 - Prob. 13ECh. 15.6 - 120. Find the median measurement for each set of...Ch. 15.6 - 120. Find the median measurement for each set of...Ch. 15.6 - 120. Find the median measurement for each set of...Ch. 15.6 - Prob. 17ECh. 15.6 - 120. Find the median measurement for each set of...Ch. 15.6 - Prob. 19ECh. 15.6 - 120. Find the median measurement for each set of...Ch. 15.6 - Prob. 21ECh. 15.6 - Find the following percentiles for the data listed...Ch. 15.6 - Prob. 23ECh. 15.6 - Prob. 24ECh. 15.6 - Prob. 25ECh. 15.6 - Prob. 26ECh. 15.6 - Find the mode for each set of measurements in...Ch. 15.6 - Prob. 28ECh. 15.6 - Prob. 29ECh. 15.6 - Prob. 30ECh. 15.6 - Prob. 31ECh. 15.6 - Prob. 32ECh. 15.6 - Prob. 33ECh. 15.6 - Find the mode for each set of measurements in...Ch. 15.6 - Prob. 35ECh. 15.6 - Find the mode for each set of measurements in...Ch. 15.6 - The cross section of the oak tree mentioned in the...Ch. 15.6 - Prob. 38ECh. 15.7 - 1-20. Find the range for each set measurements in...Ch. 15.7 - 1-20. Find the range for each set measurements in...Ch. 15.7 - Prob. 3ECh. 15.7 - 1-20. Find the range for each set measurements in...Ch. 15.7 - Prob. 5ECh. 15.7 - 1-20. Find the range for each set measurements in...Ch. 15.7 - 1-20. Find the range for each set measurements in...Ch. 15.7 - 1-20. Find the range for each set measurements in...Ch. 15.7 - Prob. 9ECh. 15.7 - 1-20. Find the range for each set measurements in...Ch. 15.7 - Prob. 11ECh. 15.7 - Prob. 12ECh. 15.7 - Prob. 13ECh. 15.7 - 1-20. Find the range for each set measurements in...Ch. 15.7 - 1-20. Find the range for each set measurements in...Ch. 15.7 - Prob. 16ECh. 15.7 - 1-20. Find the range for each set measurements in...Ch. 15.7 - 1-20. Find the range for each set measurements in...Ch. 15.7 - 1-20. Find the range for each set measurements in...Ch. 15.7 - Prob. 20ECh. 15.7 - 21-40. Find the sample standard deviation for each...Ch. 15.7 - 21-40. Find the sample standard deviation for each...Ch. 15.7 - 21-40. Find the sample standard deviation for each...Ch. 15.7 - 21-40. Find the sample standard deviation for each...Ch. 15.7 - 21-40. Find the sample standard deviation for each...Ch. 15.7 - 21-40. Find the sample standard deviation for each...Ch. 15.7 - 21-40. Find the sample standard deviation for each...Ch. 15.7 - 21-40. Find the sample standard deviation for each...Ch. 15.7 - 21-40. Find the sample standard deviation for each...Ch. 15.7 - 21-40. Find the sample standard deviation for each...Ch. 15.7 - Prob. 31ECh. 15.7 - Prob. 32ECh. 15.7 - Prob. 33ECh. 15.7 - 21-40. Find the sample standard deviation for each...Ch. 15.7 - 21-40. Find the sample standard deviation for each...Ch. 15.7 - Prob. 36ECh. 15.7 - 21-40. Find the sample standard deviation for each...Ch. 15.7 - Prob. 38ECh. 15.7 - Prob. 39ECh. 15.7 - Prob. 40ECh. 15.8 - From the following grouped data, find the mean....Ch. 15.8 - Make a frequency distribution of the following...Ch. 15.8 - A laboratory technician records the life span (in...Ch. 15.8 - The life expectancy of a fluorescent light bulb is...Ch. 15.8 - The shipment times in hours for a load of goods...Ch. 15.8 - The cost of goods stolen from a department store...Ch. 15.8 - The number of passengers and their luggage weight...Ch. 15.8 - The income of the residents in a neighborhood was...Ch. 15.8 - The number of defective parts per shipment has...Ch. 15.8 - The following dollar amounts are traffic fines...Ch. 15.8 - The length of hospital stays for patients at a...Ch. 15.8 - The frequency of repair for the trucks owned by a...Ch. 15.8 - The scores that golfers shot on 18 holes at a...Ch. 15.8 - The corn yield in bushels per acre for a certain...Ch. 15.8 - The following are the squad sizes of the football...Ch. 15.8 - Prob. 16ECh. 15.9 - 1-16. Find the sample standard deviation for each...Ch. 15.9 - Prob. 2ECh. 15.9 - Prob. 3ECh. 15.9 - 1-16. Find the sample standard deviation for each...Ch. 15.9 - Prob. 5ECh. 15.9 - 1-16. Find the sample standard deviation for each...Ch. 15.9 - Prob. 7ECh. 15.9 - Prob. 8ECh. 15.9 - Prob. 9ECh. 15.9 - Prob. 10ECh. 15.9 - Prob. 11ECh. 15.9 - Prob. 12ECh. 15.9 - Prob. 13ECh. 15.9 - Prob. 14ECh. 15.9 - Prob. 15ECh. 15.9 - 1-16. Find the sample standard deviation for each...Ch. 15.9 - Measuring the annual tree rings for the 100 +...Ch. 15.10 - A certain manufacturing process has a target value...Ch. 15.10 - A sporting goods manufacturer makes baseballs. The...Ch. 15.10 - The depth of a silicon wafer is targeted at 1.015...Ch. 15.10 - The illumination of a light bulb is targeted at...Ch. 15.11 - In Exercises 14, draw a histogram for the data...Ch. 15.11 - In Exercises 14, draw a histogram for the data...Ch. 15.11 - In Exercises 14, draw a histogram for the data...Ch. 15.11 - In Exercises 14, draw a histogram for the data...Ch. 15.11 - Use the data displayed in Table 15.1 on page 489...Ch. 15.11 - Prob. 6ECh. 15.11 - Prob. 7ECh. 15.11 - Precision Manufacturing produces 20,000 machine...Ch. 15.11 - Prob. 9ECh. 15.11 - Prob. 10ECh. 15.11 - Prob. 11ECh. 15.11 - In Exercises 912, a. Draw a scattergram for the...Ch. 15.12 - Given a normal distribution with a mean of 85 and...Ch. 15.12 - Given the 20 numbers 32, 34, 35, 41, 42, 43, 44,...Ch. 15.12 - In Exercises 36, use the frequency distribution to...Ch. 15.12 - In Exercises 36, use the frequency distribution to...Ch. 15.12 - In Exercises 36, use the frequency distribution to...Ch. 15.12 - Prob. 6ECh. 15.12 - Prob. 7ECh. 15.12 - A trouser manufacturer has an order for 80,000...Ch. 15.13 - Prob. 1ECh. 15.13 - Prob. 2ECh. 15.13 - Prob. 3ECh. 15.13 - Prob. 4ECh. 15.13 - Prob. 5ECh. 15.13 - Prob. 6ECh. 15.13 - Prob. 7ECh. 15.13 - Prob. 8ECh. 15.13 - Prob. 9ECh. 15.13 - From the sample space in Exercise 1, what is the...Ch. 15.13 - Prob. 11ECh. 15.13 - Prob. 12ECh. 15.13 - Prob. 13ECh. 15.13 - Prob. 14ECh. 15.13 - Prob. 15ECh. 15.13 - A bag contains 6 red and 4 white marbles. One...Ch. 15.13 - Prob. 17ECh. 15.13 - In a classroom, there are 18 female students and 7...Ch. 15.14 - A bag contains 1 red marble, 1 blue marble, 1...Ch. 15.14 - A card is chosen from a deck of 52 cards. It is...Ch. 15.14 - Prob. 3ECh. 15.14 - A large box of vegetables contains 4 tomatoes, 3...Ch. 15.14 - Prob. 5ECh. 15.14 - A card is chosen from a deck of cards and placed...Ch. 15.14 - Prob. 7ECh. 15.14 - A card is drawn and replaced four times from a...Ch. 15.14 - A card is drawn and replaced four times from a...Ch. 15.14 - A pair of dice is rolled. What is the probability...Ch. 15.14 - Prob. 11ECh. 15.14 - Prob. 12ECh. 15.14 - Prob. 13ECh. 15.14 - Prob. 14ECh. 15.14 - Prob. 15ECh. 15.14 - Prob. 16ECh. 15 - Prob. 1RCh. 15 - Find 56.1% of 360.Ch. 15 - Prob. 3RCh. 15 - Prob. 4RCh. 15 - Prob. 5RCh. 15 - For Exercises 68, use the following data. A...Ch. 15 - For Exercises 68, use the following data. A...Ch. 15 - For Exercises 68, use the following data. A...Ch. 15 - Given the frequency distribution in Illustration...Ch. 15 - For Exercises 1012, use the data below. A students...Ch. 15 - Prob. 11RCh. 15 - For Exercises 1012, use the data below. A students...Ch. 15 - Prob. 13RCh. 15 - Prob. 14RCh. 15 - Prob. 15RCh. 15 - A bag contains 4 white marbles, 3 red marbles, 1...Ch. 15 - See Illustration 1. What country has the longest...Ch. 15 - See Illustration 1. What country has a life...Ch. 15 - Prob. 3TCh. 15 - Prob. 4TCh. 15 - Prob. 5TCh. 15 - Prob. 6TCh. 15 - Prob. 7TCh. 15 - See Illustration 2. What is the power gain when...Ch. 15 - Prob. 9TCh. 15 - Prob. 10TCh. 15 - Prob. 11TCh. 15 - For Exercises 1214, use the data in Illustration...Ch. 15 - For Exercises 1214, use the data in Illustration...Ch. 15 - For Exercises 1214, use the data in Illustration...Ch. 15 - Prob. 15TCh. 15 - Find the sample standard deviation for each set of...
Knowledge Booster


Learn more about
Need a deep-dive on the concept behind this application? Look no further. Learn more about this topic, subject and related others by exploring similar questions and additional content below.Similar questions
- Read the decimal-inch measurement on the vernier height gage in Figure 41-2.arrow_forwardIllustration 9.7. The mean weight of 150 students in certaid class is 60 kilograms. The mean weight of boys in the class is 70 kg and that of the girls is 55 kg. Find the number of boys and the number of girls in the class.arrow_forwardAhmed is investigating how long his phone's battery lasts (in hours) for various brightness levels (on a scale of 0-100). His data is displayed in the table and graph below. Brightness Level (x) 18 20 25 29 34 57 72 83 Hours (y) 5.5 7.1 7.8 6.4 5.5 4 1.8 2.6 10 7 10 20 30 40 70 100 50 Brightness Level 60 80 90 a) Find the equation for the line of best fit. Keep at least 4 decimals for each parameter in the equation. b) Interpret the slope in context. Ahmed should expect -0.0769 hours per brightness level. O Ahmed should expect -0.0769 brightness level per hour. c) What does the equation predict for the number of hours the phone will last at a brightness level of 25?arrow_forward
- Using all the data in the image, create the following graphs: 1. Histogram 2. Frequency Ogive 3. Box Plotarrow_forwardProduce a bar graph that shows the effect of pH on the rate of reaction for amylase and examine the graph. Be sure to properly title your graph, label the axes, and provide a legend.arrow_forwardConsider the graph below and answer For what month is the graphed temperature positive and closest to 0°?arrow_forward
- Make 2 bar graph using this data one for bpm and one for resarrow_forwardThe amount of electricity used in a typical all-electric home is shown in the circle graph. If, in a certain month, a home used 2,000 kwh, find the amounts of electricity used by the water heater from the grapharrow_forwardUse the monthly average Rainfall and Temperature data to plot a typical Temperature-Rainfall graph (one graph, different plots and labels on either y-axis) of Port Moresby.arrow_forward
- Consider the graph below and Find the average of the temperatures shown for the months of January, September, and October.arrow_forwardAnswer question 10.30 in the picture and use 10.29 for reference.arrow_forwardThe graph below is the shoe sizes and heights (in inches) of 14 girls. Determine the strength of the relationship between shoe sizes and heights. Figure 2. Shoe Size 67.5959606162636465x shoe sizey Height x y graph A. Strong negative relationship B. Perfect negative relationship C. Perfect positive relationship D. Strong positive relationship Click to select your answer and then click Check Answer.arrow_forward
arrow_back_ios
SEE MORE QUESTIONS
arrow_forward_ios
Recommended textbooks for you
 Mathematics For Machine TechnologyAdvanced MathISBN:9781337798310Author:Peterson, John.Publisher:Cengage Learning,
 Glencoe Algebra 1, Student Edition, 9780079039897...AlgebraISBN:9780079039897Author:CarterPublisher:McGraw Hill
Mathematics For Machine Technology
Advanced Math
ISBN:9781337798310
Author:Peterson, John.
Publisher:Cengage Learning,
Glencoe Algebra 1, Student Edition, 9780079039897...
Algebra
ISBN:9780079039897
Author:Carter
Publisher:McGraw Hill
Hypothesis Testing using Confidence Interval Approach; Author: BUM2413 Applied Statistics UMP;https://www.youtube.com/watch?v=Hq1l3e9pLyY;License: Standard YouTube License, CC-BY
Hypothesis Testing - Difference of Two Means - Student's -Distribution & Normal Distribution; Author: The Organic Chemistry Tutor;https://www.youtube.com/watch?v=UcZwyzwWU7o;License: Standard Youtube License