
Videos
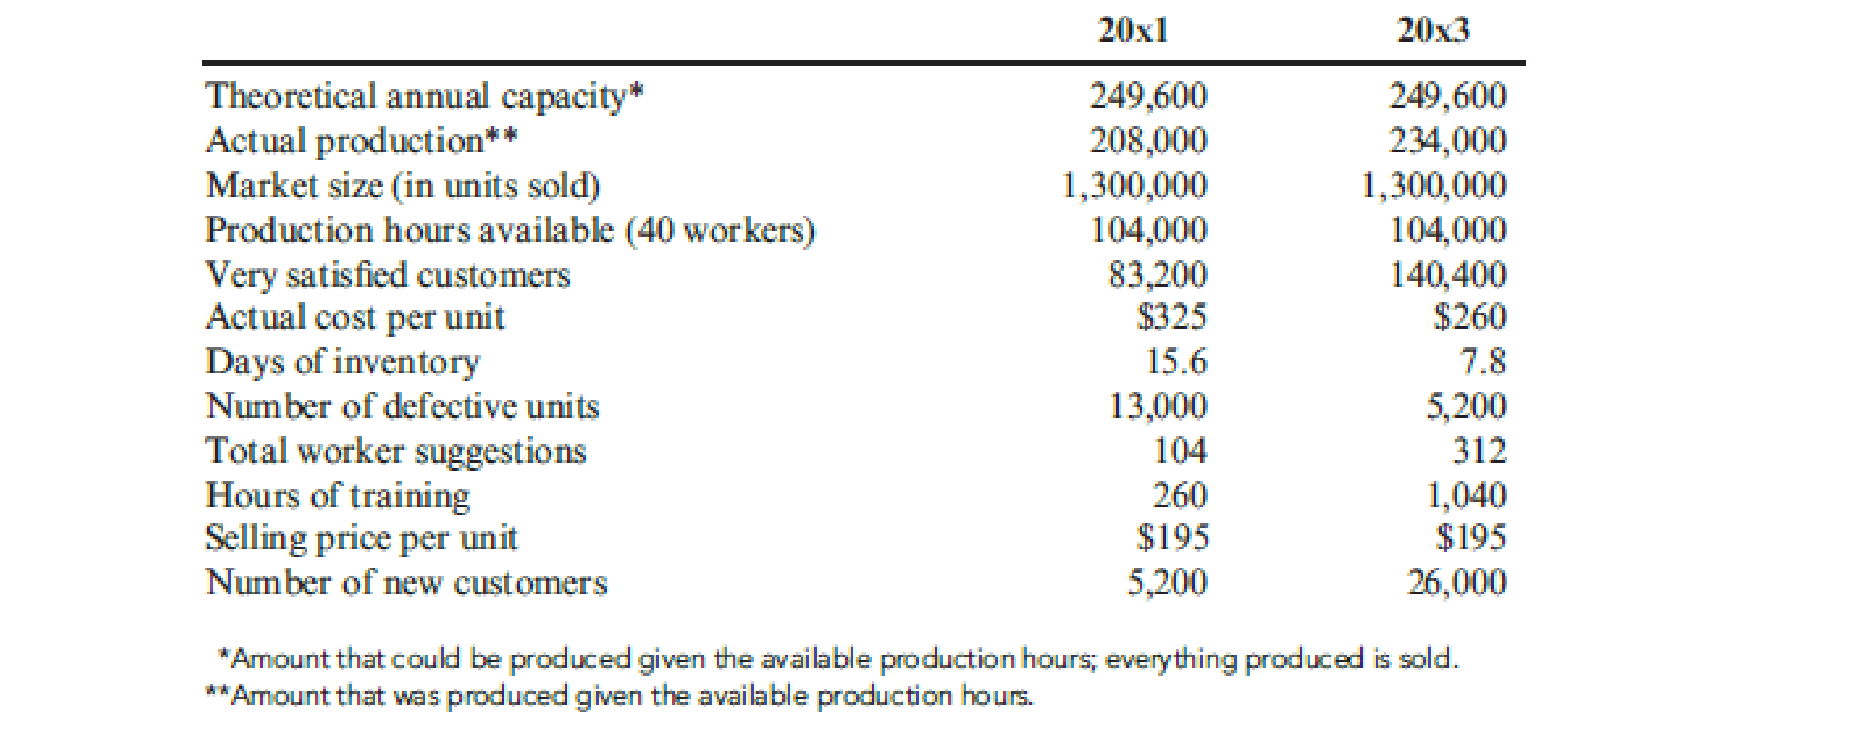
At the end of 20x1, Mejorar Company implemented a low-cost strategy to improve its competitive position. Its objective was to become the low-cost producer in its industry. A Balanced Scorecard was developed to guide the company toward this objective. To lower costs, Mejorar undertook a number of improvement activities such as JIT production, total quality management, and activity-based management. Now, after two years of operation, the president of Mejorar wants some assessment of the achievements. To help provide this assessment, the following information on one product has been gathered:
Required:
- 1. Compute the following measures for 20x1 and 20x3:
- a. Actual velocity and cycle time
- b. Percentage of total revenue from new customers (assume one unit per customer)
- c. Percentage of very satisfied customers (assume each customer purchases one unit)
- d. Market share
- e. Percentage change in actual product cost (for 20x3 only)
- f. Percentage change in days of inventory (for 20x3 only)
- g. Defective units as a percentage of total units produced
- h. Total hours of training
- i. Suggestions per production worker
- j. Total revenue
- k. Number of new customers
- 2. For the measures listed in Requirement 1, list likely strategic objectives, classified according to the four Balance Scorecard perspectives. Assume there is one measure per objective.
1. a
Compute the actual velocity and cycle time for 20x1 and 20x3.
Explanation of Solution
Cycle time and velocity: “Cycle time and velocity are two operational “measures of responsiveness”. Cycle time is the spans of time taken to produce a unit of output from the time of receipt of materials till the good is supplied to finished goods inventory. Therefore, cycle time is the time taken to produce a product”. Velocity is the number of units of output that could be produced within a given period of time”
Strategy Translation: Strategy translation is the process of specifying objectives, measures, targets, and initiatives for each individual perspective. Strategic focus is created by translating the organizations’ strategy into operational objectives and performance measures for four different perspectives.
Calculate actual velocity for 20x1:
Calculate cycle time for 20x1:
Calculate actual velocity for 20x3:
Calculate cycle time for 20x3:
b.
Calculate percentage of total revenue from new customers:
Explanation of Solution
Calculate percentage of total revenue from new customers during 20x1:
Calculate percentage of total revenue from new customers during 20x3:
c.
Calculate the percentage of satisfied customers.
Explanation of Solution
Calculate the percentage of satisfied customers for 20x1:
Calculate the percentage of satisfied customers for 20x3:
d.
Calculate value of market share.
Explanation of Solution
Calculate value of market share for 20x1:
Calculate value of market share for 20x3:
e.
Calculate percentage change in actual product cost for 20x3.
Explanation of Solution
Calculate percentage change in actual product cost for 20x3.
f.
Calculate percentage change in days of inventory for 20x3.
Explanation of Solution
Calculate percentage change in days of inventory for 20x3:
g.
Calculate the defective units as a percentage of total units produced.
Explanation of Solution
Calculate the defective units as a percentage of total units produced for 20x1:
Calculate the defective units as a percentage of total units produced for 20x3:
h.
Calculate the total hours of training.
Explanation of Solution
The total hours of training during 20x1 is 260 hours and for 20x3 is 1,040 hours.
i.
Calculate per production worker.
Explanation of Solution
Calculate per production worker for 20x1:
Calculate per production worker for 20x3:
j.
Calculate total revenue.
Explanation of Solution
Calculate total revenue during 20x1:
Calculate total revenue during 20x3:
k.
Identify the number of new customers during 20x1 and 20x3.
Explanation of Solution
The number of new customers during 20x1 is 5,200 and for 20x3 are 26,000.
2.
Provide strategic objective classified according to the four balance scorecard perspectives.
Explanation of Solution
Balanced Scorecard: Balanced scorecard is a management and planning strategy for organizational processes of defining the goals to be achieved, allocation of daily assignments on the basis of strategy, alignment of the projects on the basis of their priority and watchdog roles for its respective progress and achieving desired targets. Even though balances scorecards change from one firm to another firm, most have a combination of customer measures, measures of learning and growth, financial measures and internal business process measures.
| Strategic Objective | Measure |
| Financial | |
| Reduce unit cost | “Unit cost reduction in percentage” |
| Increase total revenue | “Revenue” |
| Develop new revenue | “Percentage of new revenues” |
| Customer | |
| Increase customer satisfaction | “Percentage of very satisfied customers” |
| Increase customer acquisition | “Number of new customers” |
| Increase market share | “Market share” |
| Process | |
| Decrease process time | “Cycle time/ velocity” |
| Decrease inventory | “Days of inventory” |
| Improve product quality | “Percentage defects” |
| Learning/Growth | |
| Increase employee capability | “Training hours” |
| increase employee motivation | “Recommendations per worker” |
Table (1)
Want to see more full solutions like this?
Chapter 13 Solutions
Cornerstones of Cost Management (Cornerstones Series)


- In 20x5, Major Company initiated a full-scale, quality improvement program. At the end of the year, Jack Aldredge, the president, noted with some satisfaction that the defects per unit of product had dropped significantly compared to the prior year. He was also pleased that relationships with suppliers had improved and defective materials had declined. The new quality training program was also well accepted by employees. Of most interest to the president, however, was the impact of the quality improvements on profitability. To help assess the dollar impact of the quality improvements, the actual sales and the actual quality costs for 20x4 and 20x5 are as follows by quality category: All prevention costs are fixed (by discretion). Assume all other quality costs are unit-level variable. Required: 1. Compute the relative distribution of quality costs for each year and prepare a pie chart. Do you believe that the company is moving in the right direction in terms of the balance among the quality cost categories? Explain. 2. Prepare a one-year trend performance report for 20x5 (compare the actual costs of 20x5 with those of 20x4, adjusted for differences in sales volume). How much have profits increased because of the quality improvements made by Major Company? 3. Estimate the additional improvement in profits if Major Company ultimately reduces its quality costs to 2.5 percent of sales revenues (assume sales of 10 million).arrow_forwardThe controller of Emery, Inc. has computed quality costs as a percentage of sales for the past 5 years (20X1 was the first year the company implemented a quality improvement program). This information is as follows: Required: 1. Prepare a trend graph for total quality costs. Comment on what the graph has to say about the success of the quality improvement program. 2. Prepare a graph that shows the trend for each quality cost category. What does the graph have to say about the success of the quality improvement program? Does this graph supply more insight than the total cost trend graph does? 3. Prepare a graph that compares the trend in relative control costs versus relative failure costs. Comment on the significance of this trend.arrow_forwardLindell Manufacturing embarked on an ambitious quality program that is centered on continual improvement. This improvement is operationalized by declining quality costs from year to year. Lindell rewards plant managers, production supervisors, and workers with bonuses ranging from 1,000 to 10,000 if their factory meets its annual quality cost goals. Len Smith, manager of Lindells Boise plant, felt obligated to do everything he could to provide this increase to his employees. Accordingly, he has decided to take the following actions during the last quarter of the year to meet the plants budgeted quality cost targets: a. Decrease inspections of the process and final product by 50% and transfer inspectors temporarily to quality training programs. Len believes this move will increase the inspectors awareness of the importance of quality; also, decreasing inspection will produce significantly less downtime and less rework. By increasing the output and decreasing the costs of internal failure, the plant can meet the budgeted reductions for internal failure costs. Also, by showing an increase in the costs of quality training, the budgeted level for prevention costs can be met. b. Delay replacing and repairing defective products until the beginning of the following year. While this may increase customer dissatisfaction somewhat, Len believes that most customers expect some inconvenience. Besides, the policy of promptly dealing with customers who are dissatisfied could be reinstated in 3 months. In the meantime, the action would significantly reduce the costs of external failure, allowing the plant to meet its budgeted target. c. Cancel scheduled worker visits to customers plants. This program, which has been very well received by customers, enables Lindell workers to see just how the machinery they make is used by the customer and also gives them first-hand information on any remaining problems with the machinery. Workers who went on previous customer site visits came back enthusiastic and committed to Lindells quality program. Lindells quality program staff believes that these visits will reduce defects during the following year. Required: 1. Evaluate Lens ethical behavior. In this evaluation, consider his concern for his employees. Was he justified in taking the actions described? If not, what should he have done? 2. Assume that the company views Lens behavior as undesirable. What can the company do to discourage it? 3. Assume that Len is a CMA and a member of the IMA. Refer to the ethical code for management accountants in Chapter 1. Were any of these ethical standards violated?arrow_forward
- The new chief executive officer (CEO) of Richard Manufacturing has asked for a variety of information about the operations of the firm from last year. The CEO is given the following information, but with some data missing: (Click the icon to view the variety of operations information.) Read the requirements, Requirement 1. Find (a) total sales revenue, (b) selling price, (c) rate of return on investment, and (d) markup percentage on full cost for this product. (a) The total sales revenue is (Round your answer to the nearest cent.) (b) The selling price per unit is (Round the retum on investment to the nearest whole percent, X%.) (c) The rate of return on investment is (d) Calculate the markup percentage on full cost for this product. (Round your intermediary calculations to the nearest cent and the markup to the nearest hundredth percent XXX%) The markup percentage on full cost for this product is Requirement 2. The new CEO has a plan to reduce fixed costs by $200,000 and variable…arrow_forward“Benchmarking against other companies enables a company to identify the lowest-cost producer. This amount should become the performance measure for next year.” Do you agree?arrow_forwardLindell Manufacturing embarked on an ambitious quality program that is centered on continual improvement. This improvement is operationalized by declining quality costs from year toyear. Lindell rewards plant managers, production supervisors, and workers with bonuses ranging from $1,000 to $10,000 if their factory meets its annual quality cost goals.Len Smith, manager of Lindell’s Boise plant, felt obligated to do everything he could toprovide this increase to his employees. Accordingly, he has decided to take the following actionsduring the last quarter of the year to meet the plant’s budgeted quality cost targets:a. Decrease inspections of the process and final product by 50% and transfer inspectorstemporarily to quality training programs. Len believes this move will increase theinspectors’ awareness of the importance of quality; also, decreasing inspection willproduce significantly less downtime and less rework. By increasing the output anddecreasing the costs of internal failure,…arrow_forward
- Key success factors. Dominic Consulting has issued a report recommending changes for its newest manufacturing client, Casper Engines. Casper Engines currently manufactures a single product, which is sold and distributed nationally. The report contains the following suggestions for enhancing business performance: Develop a hybrid engine to stay ahead of competitors Increase training hours of assembly-line personnel to decrease the currently high volumes of scrap and waste. Reduce lead times (time from customer order of product to customer receipt of product) by 20% in order to increase customer retention. Negotiate faster response times with direct material suppliers to allow for lower material inventory levels Benchmark the company’s gross margin percentages against its major competitors. Link each of these changes to the key success factors that are important to managers.arrow_forwardDataSpan, Incorporated, automated its plant at the start of the current year and installed a flexible manufacturing system. The company is also evaluating its suppliers and moving toward Lean Production. Many adjustment problems have been encountered, including problems relating to performance measurement. After much study, the company has decided to use the performance measures below, and it has gathered data relating to these measures for the first four months of operations. Throughput time (days) Delivery cycle time (days) Manufacturing cycle efficiency (MCE) Percentage of on-time deliveries Total sales (units) 1 2 Month ? ? ? ? ? ? 91% 86% 3,460 3,312 Move time per unit Process time per unit Wait time per order before start of production Queue time per unit Inspection time per unit 3 ? ? ? 82% 3,143 4 Management has asked for your help in computing throughput time, delivery cycle time, and MCE. The following average times have been logged over the last four months: ? ? ? 78% 3,025…arrow_forwardJavier Company has sales of 8 million and quality costs of 1,600,000. The company is embarking on a major quality improvement program. During the next three years, Javier intends to attack failure costs by increasing its appraisal and prevention costs. The right prevention activities will be selected, and appraisal costs will be reduced according to the results achieved. For the coming year, management is considering six specific activities: quality training, process control, product inspection, supplier evaluation, prototype testing, and redesign of two major products. To encourage managers to focus on reducing non-value-added quality costs and select the right activities, a bonus pool is established relating to reduction of quality costs. The bonus pool is equal to 10 percent of the total reduction in quality costs. Current quality costs and the costs of these six activities are given in the following table. Each activity is added sequentially so that its effect on the cost categories can be assessed. For example, after quality training is added, the control costs increase to 320,000, and the failure costs drop to 1,040,000. Even though the activities are presented sequentially, they are totally independent of each other. Thus, only beneficial activities need be selected. Required: 1. Identify the control activities that should be implemented, and calculate the total quality costs associated with this selection. Assume that an activity is selected only if it increases the bonus pool. 2. Given the activities selected in Requirement 1, calculate the following: a. The reduction in total quality costs b. The percentage distribution for control and failure costs c. The amount for this years bonus pool 3. Suppose that a quality engineer complained about the gainsharing incentive system. Basically, he argued that the bonus should be based only on reductions of failure and appraisal costs. In this way, investment in prevention activities would be encouraged, and eventually, failure and appraisal costs would be eliminated. After eliminating the non-value-added costs, focus could then be placed on the level of prevention costs. If this approach were adopted, what activities would be selected? Do you agree or disagree with this approach? Explain.arrow_forward
- In 20X1, Don Blackburn, president of Price Electronics, received a report indicating that quality costs were 31% of sales. Faced with increasing pressures from imported goods. Don resolved to take measures to improve the overall quality of the companys products. After hiring a consultant in 20X1, the company began an aggressive program of total quality control. At the end of 20X5, Don requested an analysis of the progress the company had made in reducing and controlling quality costs. The accounting department assembled the following data: Required: 1. Compute the quality costs as a percentage of sales by category and in total for each year. 2. Prepare a multiple-year trend graph for quality costs, both by total costs and by category. Using the graph, assess the progress made in reducing and controlling quality costs. Does the graph provide evidence that quality has improved? Explain. 3. Using the 20X1 quality cost relationships (assume all costs are variable), calculate the quality costs that would have prevailed in 20X4. By how much did profits increase in 20X4 because of the quality improvement program? Repeat for 20X5.arrow_forwardCarson Wellington, president of Mallory Plastics, was considering a report sent to him by Emily Sorensen, vice president of operations. The report was a summary of the progress made by an activity-based management system that was implemented three years ago. Significant progress had indeed been realized. At the conclusion of the report, Emily urged Carson to consider the adoption of the Balanced Scorecard as a logical next step in the companys efforts to establish itself as a leader in its industry. Emily clearly was impressed by the Balanced Scorecard and intrigued by the possibility that the change would enhance the overall competitiveness of Mallory. She requested a meeting of the executive committee to explain the similarities and differences between the two approaches. Carson agreed to schedule the meeting but asked Emily to prepare a memo in advance, listing the most important similarities and differences between the two approaches to responsibility accounting. Required: Prepare the memo requested by Carson.arrow_forwardAt the beginning of the last quarter of 20x1, Youngston, Inc., a consumer products firm, hired Maria Carrillo to take over one of its divisions. The division manufactured small home appliances and was struggling to survive in a very competitive market. Maria immediately requested a projected income statement for 20x1. In response, the controller provided the following statement: After some investigation, Maria soon realized that the products being produced had a serious problem with quality. She once again requested a special study by the controllers office to supply a report on the level of quality costs. By the middle of November, Maria received the following report from the controller: Maria was surprised at the level of quality costs. They represented 30 percent of sales, which was certainly excessive. She knew that the division had to produce high-quality products to survive. The number of defective units produced needed to be reduced dramatically. Thus, Maria decided to pursue a quality-driven turnaround strategy. Revenue growth and cost reduction could both be achieved if quality could be improved. By growing revenues and decreasing costs, profitability could be increased. After meeting with the managers of production, marketing, purchasing, and human resources, Maria made the following decisions, effective immediately (end of November 20x1): a. More will be invested in employee training. Workers will be trained to detect quality problems and empowered to make improvements. Workers will be allowed a bonus of 10 percent of any cost savings produced by their suggested improvements. b. Two design engineers will be hired immediately, with expectations of hiring one or two more within a year. These engineers will be in charge of redesigning processes and products with the objective of improving quality. They will also be given the responsibility of working with selected suppliers to help improve the quality of their products and processes. Design engineers were considered a strategic necessity. c. Implement a new process: evaluation and selection of suppliers. This new process has the objective of selecting a group of suppliers that are willing and capable of providing nondefective components. d. Effective immediately, the division will begin inspecting purchased components. According to production, many of the quality problems are caused by defective components purchased from outside suppliers. Incoming inspection is viewed as a transitional activity. Once the division has developed a group of suppliers capable of delivering nondefective components, this activity will be eliminated. e. Within three years, the goal is to produce products with a defect rate less than 0.10 percent. By reducing the defect rate to this level, marketing is confident that market share will increase by at least 50 percent (as a consequence of increased customer satisfaction). Products with better quality will help establish an improved product image and reputation, allowing the division to capture new customers and increase market share. f. Accounting will be given the charge to install a quality information reporting system. Daily reports on operational quality data (e.g., percentage of defective units), weekly updates of trend graphs (posted throughout the division), and quarterly cost reports are the types of information required. g. To help direct the improvements in quality activities, kaizen costing is to be implemented. For example, for the year 20x1, a kaizen standard of 6 percent of the selling price per unit was set for rework costs, a 25 percent reduction from the current actual cost. To ensure that the quality improvements were directed and translated into concrete financial outcomes, Maria also began to implement a Balanced Scorecard for the division. By the end of 20x2, progress was being made. Sales had increased to 26,000,000, and the kaizen improvements were meeting or beating expectations. For example, rework costs had dropped to 1,500,000. At the end of 20x3, two years after the turnaround quality strategy was implemented, Maria received the following quality cost report: Maria also received an income statement for 20x3: Maria was pleased with the outcomes. Revenues had grown, and costs had been reduced by at least as much as she had projected for the two-year period. Growth next year should be even greater as she was beginning to observe a favorable effect from the higher-quality products. Also, further quality cost reductions should materialize as incoming inspections were showing much higher-quality purchased components. Required: 1. Identify the strategic objectives, classified by the Balanced Scorecard perspective. Next, suggest measures for each objective. 2. Using the results from Requirement 1, describe Marias strategy using a series of if-then statements. Next, prepare a strategy map. 3. Explain how you would evaluate the success of the quality-driven turnaround strategy. What additional information would you like to have for this evaluation? 4. Explain why Maria felt that the Balanced Scorecard would increase the likelihood that the turnaround strategy would actually produce good financial outcomes. 5. Advise Maria on how to encourage her employees to align their actions and behavior with the turnaround strategy.arrow_forward
 Cornerstones of Cost Management (Cornerstones Ser...AccountingISBN:9781305970663Author:Don R. Hansen, Maryanne M. MowenPublisher:Cengage Learning
 Managerial Accounting: The Cornerstone of Busines...AccountingISBN:9781337115773Author:Maryanne M. Mowen, Don R. Hansen, Dan L. HeitgerPublisher:Cengage Learning
 Financial And Managerial AccountingAccountingISBN:9781337902663Author:WARREN, Carl S.Publisher:Cengage Learning,
 Managerial AccountingAccountingISBN:9781337912020Author:Carl Warren, Ph.d. Cma William B. TaylerPublisher:South-Western College Pub