
Cornerstones of Financial Accounting
4th Edition
ISBN: 9781337690881
Author: Jay Rich, Jeff Jones
Publisher: Cengage Learning
expand_more
expand_more
format_list_bulleted
Videos
Textbook Question
Chapter 12, Problem 91PSB
Comparing Financial Ratios
Presented below are selected ratios for four firms. Tweeter is a distiller. Clinton is a jewelry retailer, Smith is an airline, and Orlando is a hotel chain.
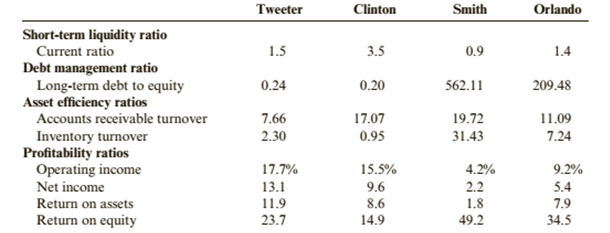
Required:
1. CONCEPTUAL CONNECTION Explain why the long-term debt to equity ratio is so much higher for the airline and hotel chain than it is for the distiller and jewelry retailer.
2. CONCEPTUAL CONNECTION Explain why the turnover ratios vary so much among the four firms.
3. CONCEPTUAL CONNECTION Explain why the return on equity for the airline and hotel chain is higher than for the distiller and jewelry retailer when their operating income and net income percentages are considerably smaller.
Expert Solution & Answer
Want to see the full answer?
Check out a sample textbook solution
Students have asked these similar questions
Interpreting Ratios. In each of the following cases, explain briefly which of the two companies is likely to be characterized by the higher ratio. (O LO3) a. Debt-to-equity ratio:
a shipping company or a computer software company
b. Payout ratio: Food Producer Inc. or Computer Graphics Inc.
c. Ratio of sales to assets: an integrated pulp and paper mill and manufacturer or a paper mill
d. Average collection period: Regional Electric Power Company or. Z-Mart Discount Outlets
Interpreting liquidity and activity ratios The table, shows key financial data for three firms that compete in the consumer products market: Procter & Gamble, Colgate-Palmolive, and Clorox.
a. Calculate each of the following ratios for all three companies: current ratio, quick ratio, inventory turnover, average collection period, total asset turnover.
b. What company is in the position of having greatest liquidity?
c. Would you say that the three companies exhibit similar performance or quite different performance in terms of collecting receivables? Why do you think that might be?
d. Which company has the most rapid inventory turnover? Which company appears to be least efficient in terms of total asset turnover? Are your answers to those questions a little surprising? If a company is best at inventory turnover and worst at total asset turnover, what do
you think that means?
a. For the three companies, the current ratios are: (Round to three decimal places.)
Colgate-Palmolive
Current…
Sales
Cost of goods sold
Receivable
Inventory
Procter & Gamble
$65,235
32,973
4,732
4,795
25,568
28,901
117,030
Total current assets
Total current liabilities
Total assets
(Note: All dollar values are in thousands.)
Colgate-Palmolive
$15,208
6,077
1,415
1,173
4,348
3,291
12,134
Clorox
$5,873
3,227
517
500
1,544
2,043
4,579
Chapter 12 Solutions
Cornerstones of Financial Accounting
Ch. 12 - Describe how some of the primary groups of users...Ch. 12 - Prob. 2DQCh. 12 - Prob. 3DQCh. 12 - Prob. 4DQCh. 12 - Prob. 5DQCh. 12 - Prob. 6DQCh. 12 - Prob. 7DQCh. 12 - Prob. 8DQCh. 12 - Prob. 9DQCh. 12 - Prob. 10DQ
Ch. 12 - Prob. 11DQCh. 12 - 12. Why are higher asset turnover ratios...Ch. 12 - Prob. 13DQCh. 12 - Prob. 14DQCh. 12 - Prob. 15DQCh. 12 - Prob. 16DQCh. 12 - Which of the following use financial statement...Ch. 12 - Prob. 2MCQCh. 12 - Prob. 3MCQCh. 12 - Prob. 4MCQCh. 12 - Prob. 5MCQCh. 12 - Prob. 6MCQCh. 12 - Prob. 7MCQCh. 12 - Which type of analysis compares a single...Ch. 12 - Which of the following types of analysis compares...Ch. 12 - Which of the following types of analysis is...Ch. 12 - Prob. 11MCQCh. 12 - Prob. 12MCQCh. 12 - Prob. 13MCQCh. 12 - Partial information from Fabray Companys balance...Ch. 12 - Hummel Inc. has $30,000 in current assets and...Ch. 12 - Prob. 16MCQCh. 12 - A firms quick ratio is typically computed as: a....Ch. 12 - Prob. 18MCQCh. 12 - Prob. 19MCQCh. 12 - Prob. 20MCQCh. 12 - Prob. 21MCQCh. 12 - Prob. 22MCQCh. 12 - Prob. 23MCQCh. 12 - When analyzing a companys debt to equity ratio,...Ch. 12 - Prob. 25MCQCh. 12 - Prob. 26MCQCh. 12 - Prob. 27MCQCh. 12 - Prob. 28MCQCh. 12 - Prob. 29MCQCh. 12 - Prob. 30MCQCh. 12 - Which of the following ratios is used to measure...Ch. 12 - Prob. 32MCQCh. 12 - Selected information for Berry Company is as...Ch. 12 - Which of the following ratios is used to measure a...Ch. 12 - Prob. 35MCQCh. 12 - Prob. 36MCQCh. 12 - Prob. 37MCQCh. 12 - Prob. 38MCQCh. 12 - Which of the following are not part of common...Ch. 12 - Prob. 40MCQCh. 12 - Prob. 41MCQCh. 12 - Prob. 42MCQCh. 12 - Which of the following is not included in the...Ch. 12 - When a Dupont analysis reveals that a company has...Ch. 12 - Prob. 45MCQCh. 12 - Cross Sectional Analysis Cross sectional analysis...Ch. 12 - Prob. 47CECh. 12 - Prob. 48CECh. 12 - Short-Term Liquidity Ratios Three ratios...Ch. 12 - Debt Management Ratios Selected data from the...Ch. 12 - Debt Management and Short-Term Liquidity Ratios...Ch. 12 - Asset Efficiency Ratios Selected financial...Ch. 12 - Profitability Ratios The following data came from...Ch. 12 - Prob. 54CECh. 12 - Prob. 55CECh. 12 - Prob. 56CECh. 12 - Prob. 57BECh. 12 - Prob. 58BECh. 12 - Prob. 59BECh. 12 - Short-Term Liquidity Ratios Larry, Curly, and Moe...Ch. 12 - Debt Management Ratios Glow Corporation provides...Ch. 12 - Debt Management and Short-Term Liquidity Ratios...Ch. 12 - Asset Efficiency Ratios Rumsford Inc.s financial...Ch. 12 - Prob. 64BECh. 12 - Profitability Ratios Tinker Corporation operates...Ch. 12 - Profitability Ratios Katrina Corp. is a publicly...Ch. 12 - Prob. 67BECh. 12 - Prob. 68ECh. 12 - Prob. 69ECh. 12 - Prob. 70ECh. 12 - Prob. 71ECh. 12 - Horizontal Analysis of Income Statements...Ch. 12 - Prob. 73ECh. 12 - Prob. 74ECh. 12 - Prob. 75ECh. 12 - Prob. 76ECh. 12 - Prob. 77ECh. 12 - Prob. 78ECh. 12 - Prob. 79ECh. 12 - Asset Efficiency Ratios Refer to financial...Ch. 12 - Prob. 81ECh. 12 - Prob. 82ECh. 12 - Prob. 83ECh. 12 - Prob. 84PSACh. 12 - Prob. 85PSACh. 12 - Prob. 86PSACh. 12 - A Using Common Size Statements The following...Ch. 12 - Prob. 88PSACh. 12 - Prob. 89PSACh. 12 - Prob. 90PSACh. 12 - A Comparing Financial Ratios Presented below are...Ch. 12 - A Preparation of Ratios Refer to the financial...Ch. 12 - Accounting Alternatives and Financial Analysis...Ch. 12 - Prob. 84PSBCh. 12 - Prob. 85PSBCh. 12 - Prob. 86PSBCh. 12 - Prob. 87PSBCh. 12 - Prob. 88PSBCh. 12 - Prob. 89PSBCh. 12 - Prob. 90PSBCh. 12 - Comparing Financial Ratios Presented below are...Ch. 12 - Prob. 92PSBCh. 12 - Problem 1 2-93B Accounting Alternatives and...Ch. 12 - Prob. 94CCh. 12 - Prob. 95.1CCh. 12 - Prob. 95.2CCh. 12 - Prob. 96.1CCh. 12 - Prob. 96.2CCh. 12 - Prob. 97.1CCh. 12 - Prob. 97.2CCh. 12 - Prob. 97.3CCh. 12 - Prob. 97.4CCh. 12 - Analyzing Growth Consolidated financial statements...Ch. 12 - Analyzing Growth Consolidated financial statements...Ch. 12 - Prob. 98.1CCh. 12 - Prob. 98.2CCh. 12 - Prob. 98.3CCh. 12 - CONTINUING PROBLEM: FRONT ROW ENTERTAINMENT The...Ch. 12 - Prob. 99.2CCh. 12 - Prob. 99.3CCh. 12 - Prob. 99.4CCh. 12 - Prob. 99.5C
Knowledge Booster


Learn more about
Need a deep-dive on the concept behind this application? Look no further. Learn more about this topic, accounting and related others by exploring similar questions and additional content below.Similar questions
- The relationship between financial leverage and profitability Pelican Paper, Inc., and Timberland Forest, Inc., are rivals in the manufacture of craft papers. Some financial statement values for each company follow. Use them in a ratio analysis that compares the firms' financial leverage and profitability. a. Calculate the following debt and coverage ratios for the two companies. Discuss their financial risk and ability to cover the costs in relation to each other. (1) Debt ratio (2) Times interest earned ratio b. Calculate the following profitability ratios for the two companies. Discuss their profitability relative to each other. (1) Operating profit margin (2) Net profit margin (3) Return on total assets (4) Return on common equity c. In what way has the larger debt of Timberland Forest made it more profitable than Pelican Paper? What are the risks that Timberland's investors undertake when they choose to purchase its stock instead of Pelican's? a. The debt ratio for Pelican is %.…arrow_forwardSargassum Caribbean Incorporated Balance Sheet as at December 31, 2020 Assets Liabilities Current Assets: Current Liabilities: Cash Accounts Payable 600,000 300,000 200,000 400,000 Notes Payable 900,000 1,500,000 Total Current Liabilities Accounts Receivable Inventory Total Current Assets 900,000 Fixed Assets: Long-Term Liabilities: Property, Plant & Equipment Less: Accumulated Depreciation 1,200,000 Long-Term Debt 1,000,000 Total Long Term Liabilities 200,000 300,000 300,000 Net Fixed Assets Owners' Equity: Common Stock ($1 Par) Capital Surplus Retained Earnings Total Owners' Equity 100,000 300,000 100,000 500,000 Total Assets 1,700,000 Total Liabilities & Owners' Equity 1,700,000 Sargassum Caribbean Incorporated Income Statement for Year Ending December 31, 2020 Sales 2,500,000 800,000 100,000 104,000 1,496,000 Less: Cost of Goods Sold Less: Administrative Expenses Less Depreciation Earnings Before Interest and Тахes Less: Interest Expense 20.000 1,476,000 663,000 813,000 417,000…arrow_forwardRead and understand the financial statements of Green Valley Merchandising, Compute for the following ratios of the said business entity: 1. Profitability Ratios a) Gross Profit Margin b) Return on Equity c) Return on Assets 2. Leverage Ratio a) Debt-to-Equity 3. Liquidity Ratios a) Current Ratio b) Quick-Asset Ratioarrow_forward
- Help with the realtionship between financial leverage and profitability. Pelican Paper, Inc., and Timberland Forest, Inc., are rivals in the manufacture of craft papers. Some financial statement values for each company follow. Use them in a ratio analysis that compares the firms' financial leverage and profitability. a. Calculate the following debt and coverage ratios for the two companies. Discuss their financial risk and ability to cover the costs in relation to each other. (1) Debt ratio (2) Times interest earned ratio b. Calculate the following profitability ratios for the two companies. Discuss their profitability relative to each other. (1) Operating profit margin (2) Net profit margin (3) Return on total assets (4) Return on common equity c. In what way has the larger debt of Timberland Forest made it more profitable than Pelican Paper? What are the risks that Timberland's investors undertake when they choose to purchase its stock instead of Pelican's?arrow_forwardPlease explain why solvency ratios, such as, debt, debt/equity, and time interest earned ratios are important to businesses. Please explain what information is provided by each ratio.arrow_forwardCarson Electronics’ management has long viewed BGT Electronics as an industry leader and uses this firm as a model firm for analyzing its own performance. The balance sheet and income statements for the two firms are as follows: Calculate the following ratios for both Carson and BGT: a) Debt ratio: b) Average collection period: c) Fixed asset turnover: d) Return on equity:arrow_forward
- 1. Ratio Analysis (Formula Approach) Step 1: Quick Take: Ratio Analysis Ratio analysis is an important way of evaluating financial statements. Using ratios, instead of simply raw financial data, can help to make better comparisons of the strength of companies. There are many different kinds of ratios, which can be grouped into five general categories: 1. Liquidity ratios: These ratios are used to analyze whether or not a firm is able to pay its short-term debts (typically maturing within the next year). Good liquidity ratios are needed to continue operations of the firm. 2. Asset management ratios: These ratios are used to analyze the efficiency of asset use by a firm. Reasonable asset management ratios are required to sustain acceptable levels of net income. 3. Debt management ratios: These ratios analyze how a firm has financed its assets, as well as whether or not the firm can repay its long-term debt. 4. Profitability ratios: These ratios analyze how profitable a firm is. These…arrow_forwardQuestion: 1) You are required to identify the three best companies based on financial strength On the Attached Image.2)You should practically focus on the interpretation of these ratios to point up companies which are best in the following respects 1.) Leverage, 2.) Debt Management & 3.) Dupont Analysis3) Once the ratios are derived, you are expected and required to comment/analyze specifically the following aspects and “point out the best three companies”:i) Chosen companies leverage.ii) Debt management.iii) DuPont variants i.e., profitability, asset efficiency, and leverage.4) Also draw strength from market intelligence, if, you have or are able to obtain about the chosen companies(s) and is worth explanation. Such information typically may include major expansion project initiated during the last two years.arrow_forwardPlease take a look below at the two companies' financial ratios. Use the material your learned in the chapter to try and identify the industries these two companies operate in. You are going to be graded on the quality of your analysis and arguments (e.g. this ratio indicates that... and that ratio indicates the other,... and taken together these ratios indicate that.... (and so forth)) : Company A Company B P/E Ratio: 30 Price/Sales: 6 Price/Book Value of Equity: 7.5 Profit Margin: 20% Operating Margin: 25% Return on Assets (ROA): 6% Return On Equity (ROE): 25% Current Ratio: 3 P/E Ratio: 17 Price/Sales: 0.6 Price/Book Value of Equity: 3 Profit Margin: 3% Operating Margin: 5% Return on Assets (ROA): 7% Return On Equity (ROE): 15% Current Ratio: 1arrow_forward
- Here you will find some income statements and balance sheets for Sears Holdings (SHLD) and Taget Corp (TGT). Assume that you are a financial manager at Sear and want to compare your firm’s situation with that of Target. Calculate represenatative ratios for liquidity, asset management efficiency, financial leverage (capital structure), and profitability for both Sears and Target. How would you summarize the financial performance of Sears compared to target (its benchmark firm)? Include Sears and Targets current ratio, acid-test ratio, average collection period, accounts receivable turnover, inventory turnover, debt ratio, timed interest earned, total asset turnover, fixed asset turnover, gross profit margin, operating profit margin, net profit margin, operating return on assets, and return on equity.arrow_forwardThe 2024 income statement of Adrian Express reports sales of $20,310,000, cost of goods sold of $12,500,000, and net income of $1,900,000. Balance sheet information is provided in the following table. Assets Current assets: Cash Accounts receivable Inventory ADRIAN EXPRESS Balance Sheets December 31, 2024 and 2023 Long-term assets Total assets Liabilities and Stockholders' Equity Current liabilities Long-term Liabilities Common stock Retained earnings Total liabilities and stockholders' equity Industry averages for the following four risk ratios are as follows: Gross profit ratio Return on assets Profit margin Asset turnover Return on equity 45% 25% 15% 6.5 35% tines 2024 2023 $800,000 $910,000 1,725,000 1,175,000 2,175,000 1,625,000 5,000,000 4,390,000 $9,700,000 $8,100,000 $2,030,000 $1,820,000 2,490,000 2,560,000 2,025,000 1,975,000 3,155,000 1,745,000 $9,700,000 $8,100,000arrow_forwardDirections: Read each sentence carefully and detemine whether the statement is TRUE or FALSE. Write your answers onthe space provided before each number. 1. Profitability ratios measure the ability of the company's assets and invested capital to generate sales. 2. Čunent ratio is generally higher than quick ratio. 3. Using anothercompany as benchmark, the company with highernet profitmarginis more profitable. 4. Accounts receivable turnover measures the number of days in the company's average collections period. 5. Firancial statement analysis uses computational and analytical techniques to evaluate the company's risks, performance, financial health, and future prospects with the objective of making economic decisions. - 6. Given equal gross profit margin, the company with the better operating income margin has higher operating expenses as a percentage of sales. 7. Debt to equity ratio measures the percentage of assets financed by equity. 8. Gross profit margin provide an indication of…arrow_forward
arrow_back_ios
SEE MORE QUESTIONS
arrow_forward_ios
Recommended textbooks for you
 Cornerstones of Financial AccountingAccountingISBN:9781337690881Author:Jay Rich, Jeff JonesPublisher:Cengage Learning
 Financial Accounting: The Impact on Decision Make...AccountingISBN:9781305654174Author:Gary A. Porter, Curtis L. NortonPublisher:Cengage Learning
Cornerstones of Financial Accounting
Accounting
ISBN:9781337690881
Author:Jay Rich, Jeff Jones
Publisher:Cengage Learning
Financial Accounting: The Impact on Decision Make...
Accounting
ISBN:9781305654174
Author:Gary A. Porter, Curtis L. Norton
Publisher:Cengage Learning
Financial ratio analysis; Author: The Finance Storyteller;https://www.youtube.com/watch?v=MTq7HuvoGck;License: Standard Youtube License