
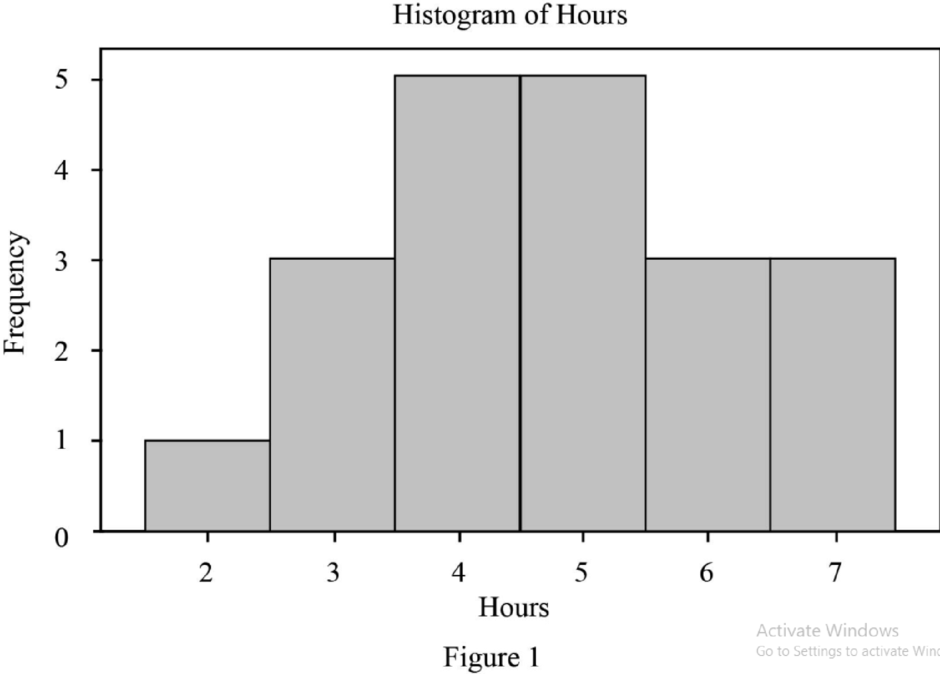
Draw the histogram of hours for 20 students.
Explanation of Solution
Figure-1 illustrates the histogram of hours for 20 students as follows:
Stem-and-leaf display:
The stem-and-leaf display is an exploratory data analysis (EDA) that is an alternative method of histogram in which data are grouped according to their leading digits, it is called ‘stems’, and the final digits, called ‘leafs, are listed separately for each member of a class. Here, the leaves are displayed individually in the ascending order after each of the steams.
Table 1 indicates the stem-and-leaf display using the given data (Data file Sun).
| Table -1 | |||||
| Stem | Leaf | ||||
| 2 | 4 | ||||
| 2 | 8 | 9 | |||
| 3 | 0 | ||||
| 3 | 6 | 6 | 9 | ||
| 4 | 0 | 4 | |||
| 4 | 5 | 6 | 8 | ||
| 5 | 0 | 2 | |||
| 5 | 5 | 8 | |||
| 6 | 2 | ||||
| 6 | 5 | 7 | |||
| 7 | 3 | ||||
Histogram: A histogram is a graph in which the vertical bars constructed on a horizontal line are marked off with intervals for the variable being displayed.
Want to see more full solutions like this?
Chapter 1 Solutions
Statistics for Business and Economics

- Waiting times (in minutes) of customers in a bank where all customers enter a single waiting line and a bank where customers wait in individual lines at three different teller windows are listed below. Find the mean and median for each of the two samples, then compare the two sets of results. Single Line Individual Lines 6.4 4.3 6.6 5.5 6.7 5.8 minutes. 6.8 6.3 7.1 6.5 C 7.2 7.8 7.6 7.8 7.8 8.7 The mean waiting time for customers in a single line is The median waiting time for customers in a single line is The mean waiting time for customers in individual lines is minutes. minutes. minutes. The median waiting time for customers in individual lines is Determine whether there is a difference between the two data sets that is not apparent from a comparison of the measures of center. If so, what is it? O A. The times for customers in a single line are much more varied than the times for customers in individual lines. O B. The times for customers in individual lines are much more varied…arrow_forwardAlejandro is selling HDMI cables on eBay, and is trying to determine the best price to sell at. For the last 10 weeks, he has adjusted his price slightly each week and tracked the number of cables he sold. He plotted the results, and drew a line he feels fits the data well. Price ($) 3, 3.25, 3.5, 3.75, 4, 4.25, 4.5, 4.75, 5 Quantity Sold - 50, 100, 150, 200, 250 a) The line of best fit passes through the points (3.50, 230) and (4.75, 210). Find an equation for the line. Use variables: p for price in dollars, and Q for quantity of cables sold. b) Using this model, predict the number of cables Alejandro would sell at a price of $3.65, to the nearest whole cable. cablesarrow_forwardA statistics instructor asks each student in his classes to report how much the student spent on textbooks for the semester. The figures reported by students are shown below. 725 735 555 420 385 480 505 270 405 285 585 450 515 560 500 395 545 595 365 455 505 345 555 485 560 475 520 455 355 590 550 495 505 505 495 465 370 355 480 385 515 605 480 410 485 560 475 350 465 435 455 380 320 535 565 520 510 495 485 650 490 295 555 540 565 490 570 380 610 600 390 375 390 335 525 445 540 490 485 555 440 560 405 590 520 470 560 510 340 385 585 635 415 455 590 385 505 510 545 405 470 560 495 515 495 595 565 615 470 680 465 470 310 470 505 465 375 360 650 460 560 500 375 500 370 415 490 440 470 525 535 640 385 475 425 595 505 365 485 495 390 380 585 690 Treat the data above as POPULATION data. 1 The mean expenditure on textbooks by all students is: a $485.38 b $495.29 c $505.40 d $515.71arrow_forward
- G. Thumb, the leading salesperson for the Moe D. Lawn Landscaping Company, turned in the following summary of sales for the week of October 23–28: Date No. of Clients Oct. 23 13 Oct. 24 8 Oct. 25 10 Oct. 26 15 Oct. 27 10 Oct. 28 22 Find the mean, median, and mode. (If an answer does not exist, enter DNE.) mean clients median clients mode clientsarrow_forwardResults Real Estate had 6 home sales during the week: $150,000, $140,000, $240,000, $158,000, $3,200,000, and $150,000. What is the mean?arrow_forward2. (4) A pediatrician wants to determine the relation that exists between a child's height and head circumference. She randomly selects 11 children from her practice, measures their heights and head circumference, and obtains the following data. 27.75 24.5 25.5 26 Height (inches) 25 Head Circumference 17.5 17.1 17.1 17.3 16.9 (inches) 27.75 26.5 27 26.75 26.75 27.5 17.6 17.3 17.5 17.3 17.5 17.5 Use 0.05 level of significance to test whether there is a linear correlation between a child's height and head circumference. Assume requirements satisfied.arrow_forward
- A random sample of data for 7 days of operation produced the following (price, quantity) data values:Price per Gallon of Paint, X Quantity Sold, Y 10 100 8 120 5 200 4 200 10 90 7 110 6 150a. Prepare a scatter plot of the data.b. Compute and interpret b1.c. Compute and interpret b0.d. How many gallons of paint would you expect to sell if the price is $7 per gallon?arrow_forward20. The table below shows the heights, in inches, of 15 ran- domly selected National Basketball Association (NBA) players and 15 randomly selected Division I National Collegiate Athletic Association (NCAA) players. 84 76 79 75 81 81 76 85 NBA 78 79 78 78 84 75 76 78 73 73 78 77 76 75 74 NCAA 74 81 75 78 78 79 73 Using the same scale, draw a box-and-whisker plot for each of the two data sets, placing the second plot belowarrow_forwardQUESTION 13 Calculate the mean from the dataset presented in the frequency table below (be sure to round response two decimal places): X f 100 3 110 9 120 10 130 12 140 18arrow_forward
- if the relationship between two variables is linear and the coefficient of determination (R2) has a value near 1, the scatter diagram has what appearance?arrow_forwardYpsilanti Market Research conducted a survey to find out whether people who earn more money purchase more expensive goods. The following graph indicates the relationship between income the survey subjects earned and the price of the car that they purchased. The variable shown on the vertical axis is __________ (options: thousands of dollars per car, thousands of dollars per year, income, thousands of dollars, price, number of goods). The units for the variable on the horizontal axis are _________ (options: thousands of dollars per car, thousands of dollars per year, income, thousands of dollars, price, number of goods). There are two ways to view the information presented on the graph. First, the graph tells us the amount a person with a certain income is likely to spend on a car, and second, it tells us the probable income of a person who spent a certain amount on a car. For example, if an individual earned $50,000 last year and purchased a new car, you would expect that person to…arrow_forwardFor each of the following variables, determine whether the variable is categorical or numerical. If the variable is numerical, determine whether the variable is discrete or continuous. In addition, determine the measurement scale. a. Time, in hours, spent working per month b. Name of a household's cable television provider c. Number of online purchases made in a month d. Satisfaction rating of a cable television provider (from low to high) e. Time, in hours, spent surfing the Internet per month a. Time, in hours, spent working per month is what kind of variable? O A. This variable is a continuous numerical variable that is ratio-scaled. O B. This variable is a discrete numerical variable that is ratio-scaled. OC. This variable is a discrete numerical variable that is interval-scaled. O D. This variable is a categorical variable that is ordinal-scaled. O E. This variable is a categorical variable that is nominal-scaled. O F. This variable is a continuous numerical variable that is…arrow_forward

 Principles of Economics (12th Edition)EconomicsISBN:9780134078779Author:Karl E. Case, Ray C. Fair, Sharon E. OsterPublisher:PEARSON
 Engineering Economy (17th Edition)EconomicsISBN:9780134870069Author:William G. Sullivan, Elin M. Wicks, C. Patrick KoellingPublisher:PEARSON
 Principles of Economics (MindTap Course List)EconomicsISBN:9781305585126Author:N. Gregory MankiwPublisher:Cengage Learning
 Managerial Economics: A Problem Solving ApproachEconomicsISBN:9781337106665Author:Luke M. Froeb, Brian T. McCann, Michael R. Ward, Mike ShorPublisher:Cengage Learning
 Managerial Economics & Business Strategy (Mcgraw-...EconomicsISBN:9781259290619Author:Michael Baye, Jeff PrincePublisher:McGraw-Hill Education