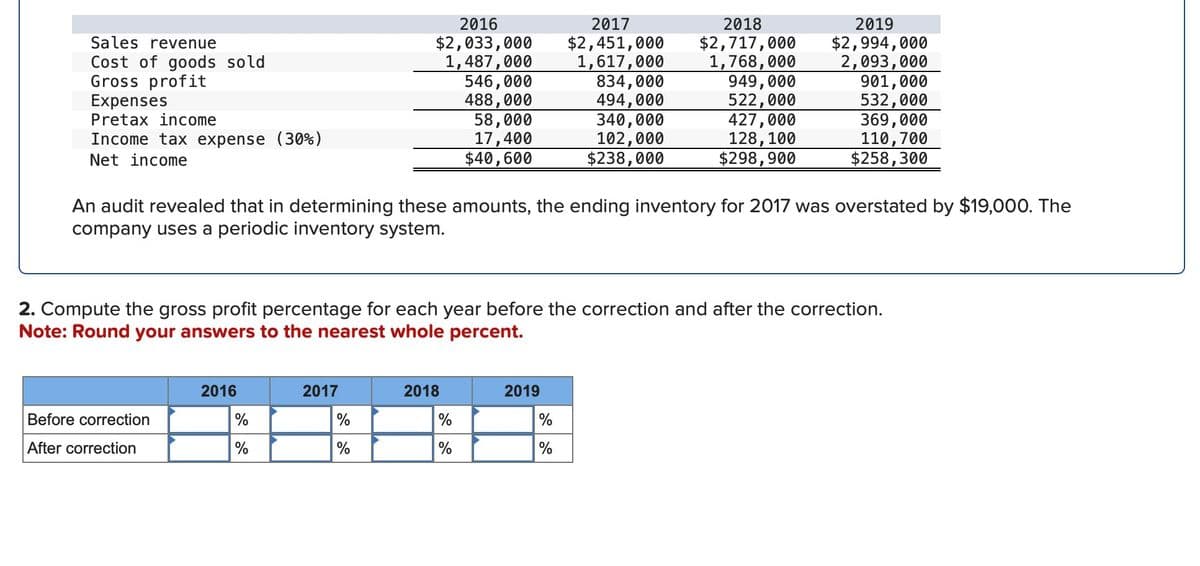
Sales revenue Cost of goods sold Gross profit Expenses Pretax income Income tax expense (30%) Net income 2016 $2,033,000 1,487,000 2017 $2,451,000 1,617,000 2018 $2,717,000 1,768,000 2019 $2,994,000 2,093,000 546,000 834,000 949,000 901,000 488,000 494,000 522,000 532,000 58,000 340,000 427,000 369,000 17,400 102,000 128,100 110,700 $40,600 $238,000 $298,900 $258,300 An audit revealed that in determining these amounts, the ending inventory for 2017 was overstated by $19,000. The company uses a periodic inventory system. 2. Compute the gross profit percentage for each year before the correction and after the correction. Note: Round your answers to the nearest whole percent.
Sales revenue Cost of goods sold Gross profit Expenses Pretax income Income tax expense (30%) Net income 2016 $2,033,000 1,487,000 2017 $2,451,000 1,617,000 2018 $2,717,000 1,768,000 2019 $2,994,000 2,093,000 546,000 834,000 949,000 901,000 488,000 494,000 522,000 532,000 58,000 340,000 427,000 369,000 17,400 102,000 128,100 110,700 $40,600 $238,000 $298,900 $258,300 An audit revealed that in determining these amounts, the ending inventory for 2017 was overstated by $19,000. The company uses a periodic inventory system. 2. Compute the gross profit percentage for each year before the correction and after the correction. Note: Round your answers to the nearest whole percent.

Financial Accounting: The Impact on Decision Makers
10th Edition
ISBN:9781305654174
Author:Gary A. Porter, Curtis L. Norton
Publisher:Gary A. Porter, Curtis L. Norton
Chapter5: Inventories And Cost Of Goods Sold
Section: Chapter Questions
Problem 5.9E: Working Backward: Gross Profit Ratio Acmes gross profit ratio increased by 20% over the prior year....

Related questions
Question
Transcribed Image Text:Sales revenue
Cost of goods sold
Gross profit
Expenses
Pretax income
Income tax expense (30%)
Net income
2016
$2,033,000
1,487,000
2017
$2,451,000
2018
$2,717,000
2019
$2,994,000
1,617,000
1,768,000
2,093,000
546,000
834,000
949,000
901,000
488,000
494,000
522,000
532,000
58,000
340,000
427,000
369,000
17,400
102,000
128,100
110,700
$40,600
$238,000
$298,900
$258,300
An audit revealed that in determining these amounts, the ending inventory for 2017 was overstated by $19,000. The
company uses a periodic inventory system.
2. Compute the gross profit percentage for each year before the correction and after the correction.
Note: Round your answers to the nearest whole percent.
2016
2017
2018
2019
Before correction
%
%
%
%
After correction
%
%
%
%
Expert Solution
This question has been solved!
Explore an expertly crafted, step-by-step solution for a thorough understanding of key concepts.

Step by step
Solved in 4 steps with 4 images

Knowledge Booster


Learn more about
Need a deep-dive on the concept behind this application? Look no further. Learn more about this topic, accounting and related others by exploring similar questions and additional content below.Recommended textbooks for you
Financial Accounting: The Impact on Decision Make…
Accounting
ISBN:
9781305654174
Author:
Gary A. Porter, Curtis L. Norton
Publisher:
Cengage Learning

Financial And Managerial Accounting
Accounting
ISBN:
9781337902663
Author:
WARREN, Carl S.
Publisher:
Cengage Learning,

Fundamentals of Financial Management (MindTap Cou…
Finance
ISBN:
9781337395250
Author:
Eugene F. Brigham, Joel F. Houston
Publisher:
Cengage Learning
Financial Accounting: The Impact on Decision Make…
Accounting
ISBN:
9781305654174
Author:
Gary A. Porter, Curtis L. Norton
Publisher:
Cengage Learning
Financial And Managerial Accounting
Accounting
ISBN:
9781337902663
Author:
WARREN, Carl S.
Publisher:
Cengage Learning,
Fundamentals of Financial Management (MindTap Cou…
Finance
ISBN:
9781337395250
Author:
Eugene F. Brigham, Joel F. Houston
Publisher:
Cengage Learning

Survey of Accounting (Accounting I)
Accounting
ISBN:
9781305961883
Author:
Carl Warren
Publisher:
Cengage Learning

Intermediate Accounting: Reporting And Analysis
Accounting
ISBN:
9781337788281
Author:
James M. Wahlen, Jefferson P. Jones, Donald Pagach
Publisher:
Cengage Learning

Cornerstones of Financial Accounting
Accounting
ISBN:
9781337690881
Author:
Jay Rich, Jeff Jones
Publisher:
Cengage Learning