On the following graph, use the orange points (square symbol) to plot points along the portion of the industry's short-run supply corresponds to prices where there is positive output. (Note: For the graphing tool to grade correctly, you must plot these points i right, starting with the point closest to the origin. You are given more points to plot than you need.) Next, place the black point (p graph to indicate the short-run equilibrium price and quantity in this market. Note: Dashed drop lines will automatically extend to both axes.
On the following graph, use the orange points (square symbol) to plot points along the portion of the industry's short-run supply corresponds to prices where there is positive output. (Note: For the graphing tool to grade correctly, you must plot these points i right, starting with the point closest to the origin. You are given more points to plot than you need.) Next, place the black point (p graph to indicate the short-run equilibrium price and quantity in this market. Note: Dashed drop lines will automatically extend to both axes.

Chapter9: Perfect Competition
Section: Chapter Questions
Problem 12QP

Related questions
Question
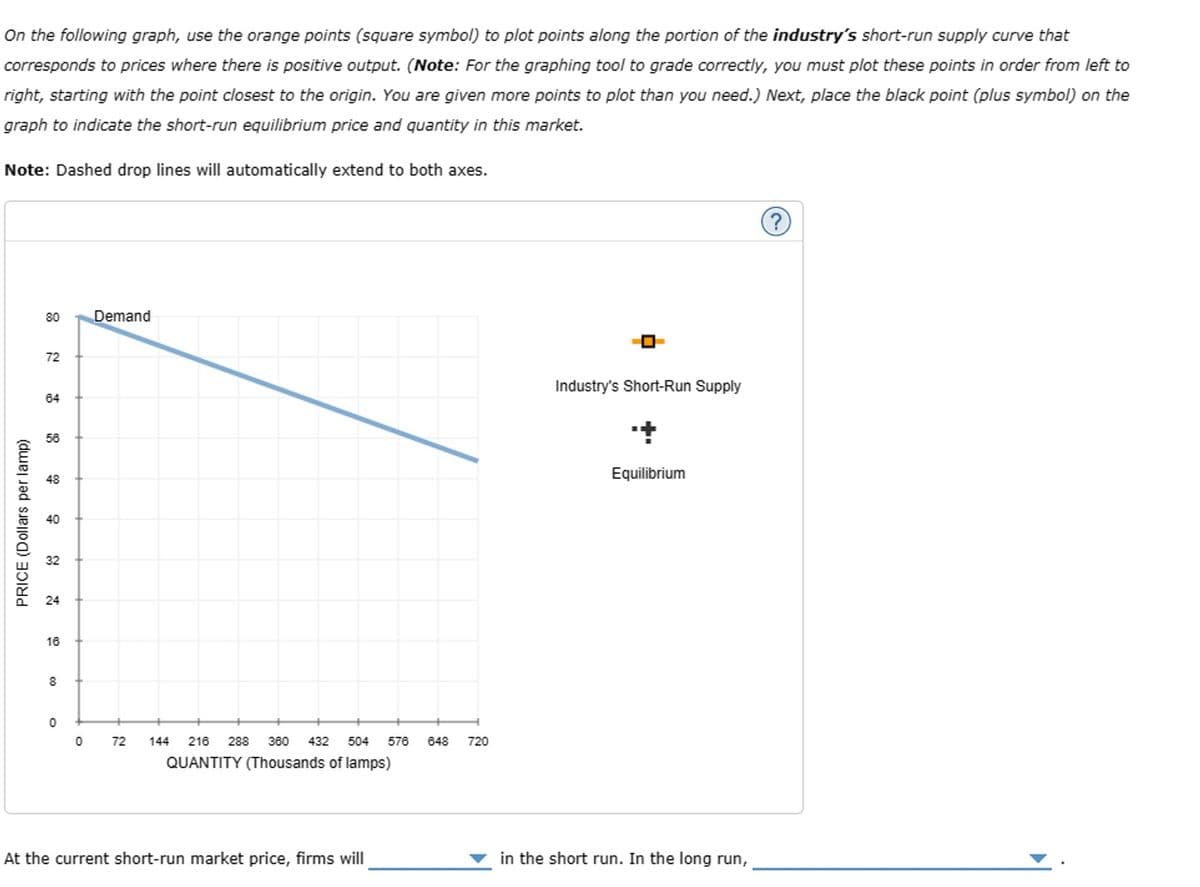
Transcribed Image Text:On the following graph, use the orange points (square symbol) to plot points along the portion of the industry's short-run supply curve that
corresponds to prices where there is positive output. (Note: For the graphing tool to grade correctly, you must plot these points in order from left to
right, starting with the point closest to the origin. You are given more points to plot than you need.) Next, place the black point (plus symbol) on the
graph to indicate the short-run equilibrium price and quantity in this market.
Note: Dashed drop lines will automatically extend to both axes.
80
72
64
56
PRICE (Dollars per lamp)
8
16
8
0
0
Demand
72
144 216 288 360 432 504
QUANTITY (Thousands of lamps)
576 648
At the current short-run market price, firms will
720
Industry's Short-Run Supply
Equilibrium
in the short run. In the long run,
Expert Solution
This question has been solved!
Explore an expertly crafted, step-by-step solution for a thorough understanding of key concepts.

This is a popular solution!

Trending now
This is a popular solution!

Step by step
Solved in 3 steps with 1 images

Knowledge Booster


Learn more about
Need a deep-dive on the concept behind this application? Look no further. Learn more about this topic, economics and related others by exploring similar questions and additional content below.Recommended textbooks for you

Economics (MindTap Course List)
Economics
ISBN:
9781337617383
Author:
Roger A. Arnold
Publisher:
Cengage Learning

Exploring Economics
Economics
ISBN:
9781544336329
Author:
Robert L. Sexton
Publisher:
SAGE Publications, Inc
Economics (MindTap Course List)
Economics
ISBN:
9781337617383
Author:
Roger A. Arnold
Publisher:
Cengage Learning
Exploring Economics
Economics
ISBN:
9781544336329
Author:
Robert L. Sexton
Publisher:
SAGE Publications, Inc