
Financial Reporting, Financial Statement Analysis and Valuation
8th Edition
ISBN: 9781285190907
Author: James M. Wahlen, Stephen P. Baginski, Mark Bradshaw
Publisher: Cengage Learning
expand_more
expand_more
format_list_bulleted
Videos
Textbook Question
Chapter 10, Problem 5QE
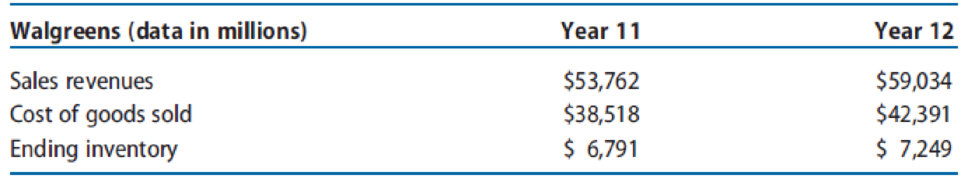
Use the following hypothetical data for Walgreens in Years 11 and 12 to project revenues, cost of goods sold, and inventory for Year +1. Assume that Walgreens’s Year +1 revenue growth rate, gross profit margin, and inventory turnover will be identical to Year 12. Project the average inventory balance in Year +1 and use it to compute the implied ending inventory balance.
Expert Solution & Answer
Want to see the full answer?
Check out a sample textbook solution
Students have asked these similar questions
An analyst wants to compare one firm's level of inventory last year to a competitor firm's level of
inventory last year. Which one of the following financial statements provided for both firms would
best help achieve this objective?
Common size income statement
Pro forma balance sheet
Common size balance sheet
Pro forma income statement
Assuming that all net sales figures are at retail and all cost of goods sold figures are at cost, calculate the average inventory (in $) and inventory turnover for the following. If the actual turnover is less than the published rate, calculate the target average inventory necessary to come up to industry standards. If the actual turnover is greater than the published rate, enter "above" for target average inventory. Round inventories to the nearest dollar and inventory turnovers to the nearest tenth
Net Sales
Cost ofGoods Sold
BeginningInventory
EndingInventory
AverageInventory
InventoryTurnover
PublishedRate
TargetAverageInventory
$580,000
$137,250
$77,200
$
4.8
$
Assuming that all net sales figures are at retail and all cost of goods sold figures are at cost, calculate the average inventory (in $) and inventory turnover for the following. If the actual turnover is
less than the published rate, calculate the target average inventory (in $) necessary to come up to industry standards. If the actual turnover is greater than the published rate, enter "above" for
target average inventory. Round inventories to the nearest dollar and inventory turnovers to the nearest tenth.
Net Sales
$4,560,000
Cost of
Goods Sold
Beginning Ending
Inventory Inventory
$858,000 $654,300
Average
Inventory
$
Inventory Published
Turnover
Rate
8.2
Target
Average
Inventory
Chapter 10 Solutions
Financial Reporting, Financial Statement Analysis and Valuation
Ch. 10 - Prob. 1QECh. 10 - The chapter encourages analysts to develop...Ch. 10 - Prob. 3QECh. 10 - Suppose you are analyzing a firm that is...Ch. 10 - Use the following hypothetical data for Walgreens...Ch. 10 - Prob. 6QECh. 10 - Prob. 7QECh. 10 - Prob. 8QECh. 10 - The Home Depot is a leading specialty retailer of...Ch. 10 - Prob. 10PC
Knowledge Booster


Learn more about
Need a deep-dive on the concept behind this application? Look no further. Learn more about this topic, finance and related others by exploring similar questions and additional content below.Similar questions
- Use the following information relating to Clover Company to calculate the inventory turnover ratio, gross margin, and the number of days sales in inventory ratio, for years 2022 and 2023.arrow_forwardWhen the double-extension approach to the dollar-value LIFO inventory cost flow method is used, the inventory layer added in the current year is multiplied by an index number. How would the following be used in the calculation of this index number?arrow_forwardUse the following information relating to Medinas Company to calculate the inventory turnover ratio, gross margin, and the number of days sales in inventory ratio, for years 2022 and 2023.arrow_forward
- Suppose a company's cost of goods sold for years 2 and 3 were $283,310 and $299,390 respectively. Also suppose that inventory had a balance of $34,740 at the end of year 1, $35,168 at the end of year 2, and $36,356 at the end of year 3. If the annual growth in total revenues is 8.42% for the foreseeable future, calculate the forecasted inventory balance at the end of year 5. Assume the same inventory turnover in all future years as that in year 3 calculated using the average asset balances. Also assume the same gross margin % in all future years as that in year 3. Note that year 3 is the latest year with reported results, while years 4 onwards are all forecasted years.arrow_forwardPrepare a basic income statement forecast for the subsequent fiscal year, using a percentage of sales approach and using information included in the materials below to support assumptions that correspond for each revenue and expense. Each line item (e.g., marketing expenses) should have a note and an explanation on how it was calculated.arrow_forwardAssuming that all net sales figures are at retail and all cost of goods sold figures are at cost, calculate the average inventory (in $) and inventory turnover for the following. If the actual turnover is less than the published rate, calculate the target average inventory (in necessary to come up to industry standards. If the actual turnover is greater than the published rate, enter "above" for target average inventory. Round inventories to the nearest dollar and inventory turnovers to the nearest tenth. Net Sales Cost of Goods Sold $345,000 Need Help? Read It Beginning Inventory $44,000 Ending Inventory $52,000 $ Average Inventory Inventory Turnover Published Rate 6.0 $ Target Average Inventoryarrow_forward
- Assuming that all net sales figures are at retail and all cost of goods sold figures are at cost, calculate the average inventory and inventory turmover for the following. If the actual turnover is less than the published rate, calculate the target average inventory necessary to come up to industry standards. Enter "above" (without the quotes) for the target inventory if it is more than the published rate. Round inventories to the nearest dollar and inventory turnover to the nearest tenth. Cost of Beginning Ending Average Inventory Published Target Average Net Sales Goods Sold Inventory Inventory Inventory Turnover Rate Inventory $378,000 $49,000 $56,000 $ 52500 7.2 5.2arrow_forwardA condensed income statement for Weber Associates and a partially completed vertical analysis follow. Required: 1. Complete the vertical analysis by computing each missing line item as a percentage of net revenues. TIP: In the prior year, Cost of Goods Sold was 31 percent of Net Revenues, computed as ($1,397 ÷ $4,571). 2. Does Cost of Goods Sold, as a percentage of Net Revenues, represent better or worse performance in 2019 as compared to 2018? Complete this question by entering your answers in the tabs below. Required 1 Required 2 Complete the vertical analysis by computing each missing line item as a percentage of net revenues. TIP: In the prior year, Cost of Goods Sold was 31 percent of Net Revenues, computed as ($1,397 ÷ $4,571). (Decreases should be indicated by a minus sign. Round your answers to the nearest whole percent.) Net Revenues Cost of Goods Sold Research and Development Expense Sales and Marketing Expense General and Administrative Expense Income from Operations Other…arrow_forwardAssuming that all net sales figures are at retail and all cost of goods sold figures are at cost, calculate the average inventory (in $) and inventory turnover for the following. If the actual turnover is less than the published rate, calculate the target average inventory necessary to come up to industry standards. If the actual turnover is greater than the published rate, enter "above" for target average inventory. Round inventories to the nearest dollar and inventory turnovers to the nearest tenth Net Sales $560,000 Cost of Goods Sold Beginning Ending Inventory Inventory $137,250 $75,200 $ Average Inventory Inventory Turnover Published Rate 4.8 $ Target Average Inventoryarrow_forward
- Assuming that all net sales figures are at retail and all cost of goods sold figures are at cost, calculate the average inventory (in $) and inventory turnover for the following. If the actual turnover is less than the published rate, calculate the target average inventory necessary to come up to industry standards. If the actual turnover is greater than the published rate, enter "above" for target average inventory. Round inventories to the nearest dollar and inventory turnovers to the nearest tenth Net Sales $580,000 Cost of Goods Sold Beginning Inventory $131,250 Ending Inventory $77,200 Average Inventory $ 104,225 ✔ 6.08 Inventory Turnover x Published Rate 4.8 Target Average Inventory $ 132,093.75 xarrow_forwardAssuming that all net sales figures are at retail and all cost of goods sold figures are at cost, calculate the average inventory (in $) and inventory turnover for the following. If the actual turnover is less than the published rate, calculate the target average inventory necessary to come up to industry standards. If the actual turnover is greater than the published rate, enter "above" for target average inventory. Round inventories to the nearest dollar and inventory turnovers to the nearest tenth Net Sales $580,000 Cost of Goods Sold Beginning Inventory Ending Inventory $139,250 $77,200 Average Inventory $ 108225 Inventory Turnover X Published Rate 4.8 Target Average Inventory $arrow_forward6. The following is the adjusted trial balance data for Nino's Pizzenia as of December 31, 2019. NINO'S PIZZERIA Adjusted Trlal Balance Year Ended December 31,2019 Debit Credit S 775,984 45,688 200,460 135,624 Cash Accounts Receivable Buildings Merchandise Inventory Accounts Payable Common Stock Sales Interest Revenue Rent Revenue Sales Salaries Expense office Supplies Expense Sales Discounts Interest Expense Sales Returns and Allowances, Cost of goods sold Rent Expense Depreciation Expense: Office Equipment Insurance Expense Advertising Expense Totals $437,880 410,542 555,696 84,652 86,900 24,500 6,270 102,890 4,577 105.854 122,853 20.000 10.555 2,780 17:635 $1,575,670 $1,575,670arrow_forward
arrow_back_ios
SEE MORE QUESTIONS
arrow_forward_ios
Recommended textbooks for you
 Financial Reporting, Financial Statement Analysis...FinanceISBN:9781285190907Author:James M. Wahlen, Stephen P. Baginski, Mark BradshawPublisher:Cengage Learning
 Principles of Accounting Volume 1AccountingISBN:9781947172685Author:OpenStaxPublisher:OpenStax College
 College Accounting, Chapters 1-27AccountingISBN:9781337794756Author:HEINTZ, James A.Publisher:Cengage Learning,
 Intermediate Accounting: Reporting And AnalysisAccountingISBN:9781337788281Author:James M. Wahlen, Jefferson P. Jones, Donald PagachPublisher:Cengage Learning
Financial Reporting, Financial Statement Analysis...
Finance
ISBN:9781285190907
Author:James M. Wahlen, Stephen P. Baginski, Mark Bradshaw
Publisher:Cengage Learning
Principles of Accounting Volume 1
Accounting
ISBN:9781947172685
Author:OpenStax
Publisher:OpenStax College
College Accounting, Chapters 1-27
Accounting
ISBN:9781337794756
Author:HEINTZ, James A.
Publisher:Cengage Learning,
Intermediate Accounting: Reporting And Analysis
Accounting
ISBN:9781337788281
Author:James M. Wahlen, Jefferson P. Jones, Donald Pagach
Publisher:Cengage Learning
IAS 29 Financial Reporting in Hyperinflationary Economies: Summary 2021; Author: Silvia of CPDbox;https://www.youtube.com/watch?v=55luVuTYLY8;License: Standard Youtube License