The dataset Silverweight .csv contains data collected "The Absolute Isotopic Abundance and Atomic Weight of a Reference Sample of Silver" from NBS Journal of Research, 87, pp. 9-19. It compared the Atomic weight of silver (in Aus) as measured by 2 different instruements. (a) Perform a hypothesis test to determine if their is evidence for the existence of bias or improper calibration in one of the instruments, use a = 0.01. (b) Construct a 99% confidence interval for the difference in the estimated atomic weights. (c) Evaluate the assumptions of your hypothesis test in a). (d) Compute an appropriate effect size for the difference in estimates between the two techniques. (e) Estimate the difference in calibrations (effect size as measured as difference of the means) that you have a 90% chance of detecting for this dataset. Use sp = 1.7 x 10⁻⁵ Au of the sample as approximately equal to o and a sample size of 24 in each group. - (f) What sample size would you need in order to have an 80% chance of detecting a calibration erence of 0.8 x 10⁻⁵ Au between the two machines. (g) Construct a plot to show the mean silver weight measured on both instruments.
The dataset Silverweight .csv contains data collected "The Absolute Isotopic Abundance and Atomic Weight of a Reference Sample of Silver" from NBS Journal of Research, 87, pp. 9-19. It compared the Atomic weight of silver (in Aus) as measured by 2 different instruements. (a) Perform a hypothesis test to determine if their is evidence for the existence of bias or improper calibration in one of the instruments, use a = 0.01. (b) Construct a 99% confidence interval for the difference in the estimated atomic weights. (c) Evaluate the assumptions of your hypothesis test in a). (d) Compute an appropriate effect size for the difference in estimates between the two techniques. (e) Estimate the difference in calibrations (effect size as measured as difference of the means) that you have a 90% chance of detecting for this dataset. Use sp = 1.7 x 10⁻⁵ Au of the sample as approximately equal to o and a sample size of 24 in each group. - (f) What sample size would you need in order to have an 80% chance of detecting a calibration erence of 0.8 x 10⁻⁵ Au between the two machines. (g) Construct a plot to show the mean silver weight measured on both instruments.

MATLAB: An Introduction with Applications
6th Edition
ISBN:9781119256830
Author:Amos Gilat
Publisher:Amos Gilat
Chapter1: Starting With Matlab
Section: Chapter Questions
Problem 1P

Related questions
Question
Parts a-g
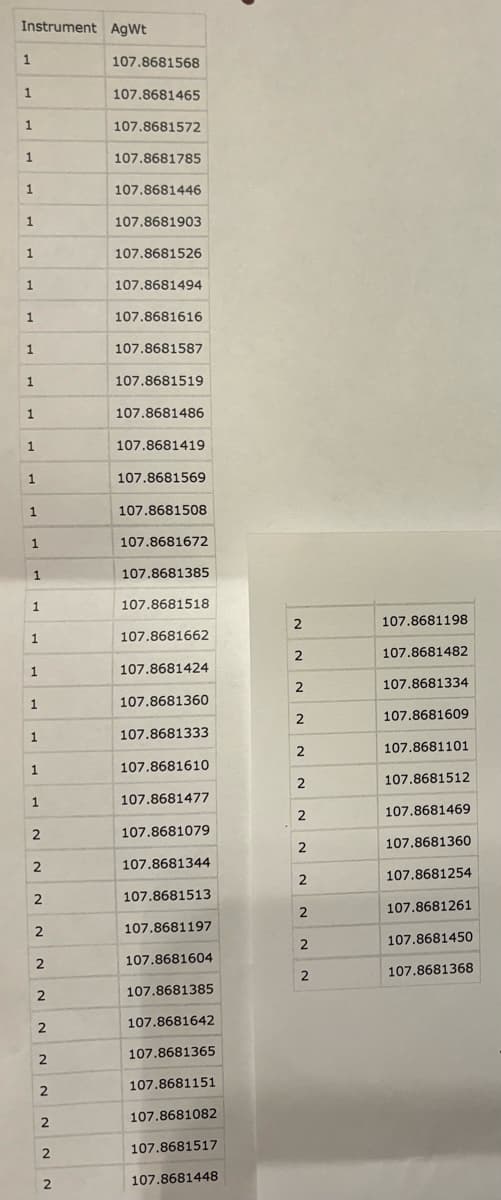
Transcribed Image Text:Instrument AgWt
1
1
1
1
1
1
1
1
1
1
1
1
1
1
1
1
1
1
1
1
1
1
1
1
2
2
2
2
2
2
2
2
2
2
2
2
107.8681568
107.8681465
107.8681572
107.8681785
107.8681446
107.8681903
107.8681526
107.8681494
107.8681616
107.8681587
107.8681519
107.8681486
107.8681419
107.8681569
107.8681508
107.8681672
107.8681385
107.8681518
107.8681662
107.8681424
107.8681360
107.8681333
107.8681610
107.8681477
107.8681079
107.8681344
107.8681513
107.8681197
107.8681604
107.8681385
107.8681642
107.8681365
107.8681151
107.8681082
107.8681517
107.8681448
2
2
2
2
2
2
2
2
2
2
2
2
107.8681198
107.8681482
107.8681334
107.8681609
107.8681101
107.8681512
107.8681469
107.8681360
107.8681254
107.8681261
107.8681450
107.8681368
Transcribed Image Text:The dataset Silverweight.csv contains data collected "The Absolute Isotopic Abundance and Atomic
Weight of a Reference Sample of Silver" from NBS Journal of Research, 87, pp. 9-19. It compared the
Atomic weight of silver (in Aus) as measured by 2 different instruements.
(a) Perform a hypothesis test to determine if their is evidence for the existence of bias or improper
calibration in one of the instruments, use a = 0.01.
(b) Construct a 99% confidence interval for the difference in the estimated atomic weights.
(c) Evaluate the assumptions of your hypothesis test in a).
(d) Compute an appropriate effect size for the difference in estimates between the two techniques.
(e) Estimate the difference in calibrations (effect size as measured as difference of the means) that
you have a 90% chance of detecting for this dataset. Use sp = 1.7 x 10⁻⁵ Au of the sample as
approximately equal to o and a sample size of 24 in each group.
(f) What sample size would you need in order to have an 80% chance of detecting a calibration
difference of 0.8 x 10⁻⁵ Au between the two machines.
(g) Construct a plot to show the mean silver weight measured on both instruments.
Expert Solution
This question has been solved!
Explore an expertly crafted, step-by-step solution for a thorough understanding of key concepts.

This is a popular solution!

Trending now
This is a popular solution!

Step by step
Solved in 5 steps with 17 images

Recommended textbooks for you
MATLAB: An Introduction with Applications
Statistics
ISBN:
9781119256830
Author:
Amos Gilat
Publisher:
John Wiley & Sons Inc

Probability and Statistics for Engineering and th…
Statistics
ISBN:
9781305251809
Author:
Jay L. Devore
Publisher:
Cengage Learning

Statistics for The Behavioral Sciences (MindTap C…
Statistics
ISBN:
9781305504912
Author:
Frederick J Gravetter, Larry B. Wallnau
Publisher:
Cengage Learning
MATLAB: An Introduction with Applications
Statistics
ISBN:
9781119256830
Author:
Amos Gilat
Publisher:
John Wiley & Sons Inc
Probability and Statistics for Engineering and th…
Statistics
ISBN:
9781305251809
Author:
Jay L. Devore
Publisher:
Cengage Learning
Statistics for The Behavioral Sciences (MindTap C…
Statistics
ISBN:
9781305504912
Author:
Frederick J Gravetter, Larry B. Wallnau
Publisher:
Cengage Learning

Elementary Statistics: Picturing the World (7th E…
Statistics
ISBN:
9780134683416
Author:
Ron Larson, Betsy Farber
Publisher:
PEARSON

The Basic Practice of Statistics
Statistics
ISBN:
9781319042578
Author:
David S. Moore, William I. Notz, Michael A. Fligner
Publisher:
W. H. Freeman

Introduction to the Practice of Statistics
Statistics
ISBN:
9781319013387
Author:
David S. Moore, George P. McCabe, Bruce A. Craig
Publisher:
W. H. Freeman