REAL INTEREST RATE Suppose a hypothetical open economy uses the U.S. dollar as currency. The table below presents data describing the relationship between different real interest rates and this economy's levels of national saving, domestic investment, and net capital outflow. Assume that the economy is currently operating under a balanced government budget. Real Interest Rate (Percent) National Saving (Billions of dollars) Domestic Investment (Billions of dollars) 7 50 20 Net Capital Outflow (Billions of dollars) -10 6 45 30 -5 5 40 40 0 4 35 50 3 30 60 10 2 25 R 70 in 90 15 Given the information in the table above, use the blue points (circle symbol) to plot the demand for loanable funds. Next, use the orange points (square symbol) to plot the supply of loanable funds. Finally, use the black point (cross symbol) to indicate the equilibrium in this market. 2 10 8 0 0 20 Market for Loanable Funds 40 60 80 100 QUANTITY OF LOANABLE FUNDS Demand ㅁ Supply +- Equilibrium REAL INTEREST RATE On the following graph, plot the relationship between the real interest rate and net capital outflow by using the green points (triangle symbol) to plot the points from the initial data table. Then use the black point (X symbol) to indicate the level of net capital outflow at the equilibrium real interest rate you derived in the previous graph. -20 -15 2 6 Net Capital Outflow 8 10 5 10 -10 -5 0 NET CAPITAL OUTFLOW (Billions of dollars) 15 20 + ▷ NCO Eqm. NCO (?)
REAL INTEREST RATE Suppose a hypothetical open economy uses the U.S. dollar as currency. The table below presents data describing the relationship between different real interest rates and this economy's levels of national saving, domestic investment, and net capital outflow. Assume that the economy is currently operating under a balanced government budget. Real Interest Rate (Percent) National Saving (Billions of dollars) Domestic Investment (Billions of dollars) 7 50 20 Net Capital Outflow (Billions of dollars) -10 6 45 30 -5 5 40 40 0 4 35 50 3 30 60 10 2 25 R 70 in 90 15 Given the information in the table above, use the blue points (circle symbol) to plot the demand for loanable funds. Next, use the orange points (square symbol) to plot the supply of loanable funds. Finally, use the black point (cross symbol) to indicate the equilibrium in this market. 2 10 8 0 0 20 Market for Loanable Funds 40 60 80 100 QUANTITY OF LOANABLE FUNDS Demand ㅁ Supply +- Equilibrium REAL INTEREST RATE On the following graph, plot the relationship between the real interest rate and net capital outflow by using the green points (triangle symbol) to plot the points from the initial data table. Then use the black point (X symbol) to indicate the level of net capital outflow at the equilibrium real interest rate you derived in the previous graph. -20 -15 2 6 Net Capital Outflow 8 10 5 10 -10 -5 0 NET CAPITAL OUTFLOW (Billions of dollars) 15 20 + ▷ NCO Eqm. NCO (?)

Chapter20: Exchange Rates And The Macroeconomy
Section: Chapter Questions
Problem 3TY

Related questions
Question
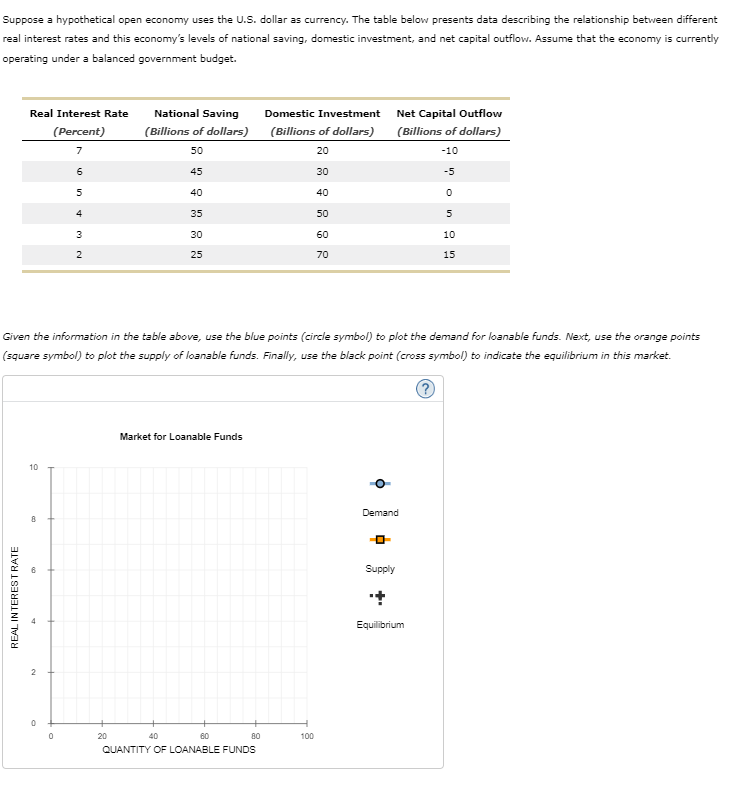
Transcribed Image Text:REAL INTEREST RATE
Suppose a hypothetical open economy uses the U.S. dollar as currency. The table below presents data describing the relationship between different
real interest rates and this economy's levels of national saving, domestic investment, and net capital outflow. Assume that the economy is currently
operating under a balanced government budget.
Real Interest Rate
(Percent)
National Saving
(Billions of dollars)
Domestic Investment
(Billions of dollars)
7
50
20
Net Capital Outflow
(Billions of dollars)
-10
6
45
30
-5
5
40
40
0
4
35
50
3
30
60
10
2
25
R
70
in 90
15
Given the information in the table above, use the blue points (circle symbol) to plot the demand for loanable funds. Next, use the orange points
(square symbol) to plot the supply of loanable funds. Finally, use the black point (cross symbol) to indicate the equilibrium in this market.
2
10
8
0
0
20
Market for Loanable Funds
40
60
80
100
QUANTITY OF LOANABLE FUNDS
Demand
ㅁ
Supply
+-
Equilibrium
Transcribed Image Text:REAL INTEREST RATE
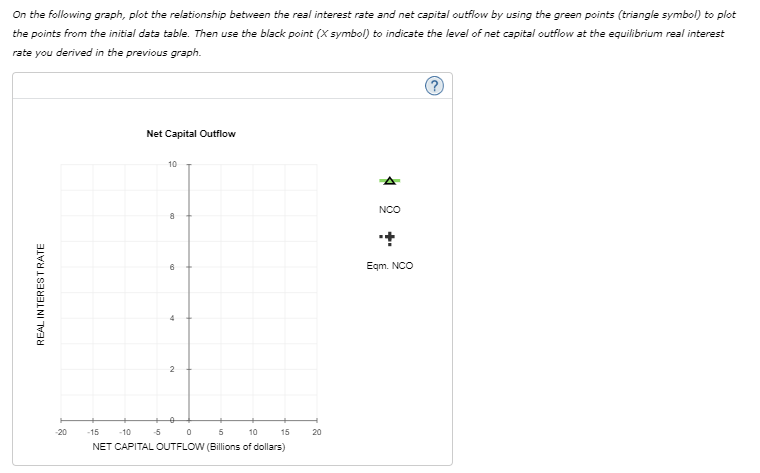
On the following graph, plot the relationship between the real interest rate and net capital outflow by using the green points (triangle symbol) to plot
the points from the initial data table. Then use the black point (X symbol) to indicate the level of net capital outflow at the equilibrium real interest
rate you derived in the previous graph.
-20
-15
2
6
Net Capital Outflow
8
10
5
10
-10 -5 0
NET CAPITAL OUTFLOW (Billions of dollars)
15
20
+ ▷
NCO
Eqm. NCO
(?)
Expert Solution
This question has been solved!
Explore an expertly crafted, step-by-step solution for a thorough understanding of key concepts.

This is a popular solution!

Trending now
This is a popular solution!

Step by step
Solved in 2 steps

Recommended textbooks for you

Exploring Economics
Economics
ISBN:
9781544336329
Author:
Robert L. Sexton
Publisher:
SAGE Publications, Inc

Principles of Economics (MindTap Course List)
Economics
ISBN:
9781305585126
Author:
N. Gregory Mankiw
Publisher:
Cengage Learning
Exploring Economics
Economics
ISBN:
9781544336329
Author:
Robert L. Sexton
Publisher:
SAGE Publications, Inc
Principles of Economics (MindTap Course List)
Economics
ISBN:
9781305585126
Author:
N. Gregory Mankiw
Publisher:
Cengage Learning

Brief Principles of Macroeconomics (MindTap Cours…
Economics
ISBN:
9781337091985
Author:
N. Gregory Mankiw
Publisher:
Cengage Learning

Principles of Macroeconomics (MindTap Course List)
Economics
ISBN:
9781305971509
Author:
N. Gregory Mankiw
Publisher:
Cengage Learning

Principles of Economics, 7th Edition (MindTap Cou…
Economics
ISBN:
9781285165875
Author:
N. Gregory Mankiw
Publisher:
Cengage Learning