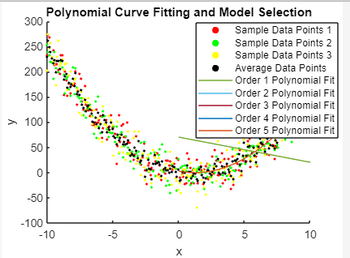
close all; clear all; clc; current_script = mfilename('fullpath'); script_directory = fileparts(current_script); file_name0 = 'data_00.csv'; file_name1 = 'data_01.csv'; file_name2 = 'data_02.csv'; file_name3 = 'data_03.csv'; data0 = csvread([script_directory '\' file_name0]); data1 = csvread([script_directory '\' file_name1]); data2 = csvread([script_directory '\' file_name2]); data3 = csvread([script_directory '\' file_name3]); avg_data = (data1 + data2 + data3) / 3; figure; % plot (data0(:,1), data0(:,2), 'b-', 'LineWidth', 2, 'DisplayName', 'Parabolic Curve'); hold on; % plot(avg_data(:, 1), avg_data(:, 2), 'k-', 'Linewidth', 1, 'DisplayName', 'Average Data Points'); plot(smooth_data(:, 1), smooth_data(:, 2), 'k-', 'Linewidth', 1, 'DisplayName', 'Smoothed Data'); scatter(data1(:,1), data1(:,2), 5, 'r', 'filled', 'DisplayName', 'Sample Data Points 1'); scatter(data2(:,1), data2(:,2), 5, 'g', 'filled', 'DisplayName', 'Sample Data Points 2'); scatter(data3(:,1), data3(:,2), 5, 'y', 'filled', 'DisplayName', 'Sample Data Points 3'); scatter(avg_data(:,1), avg_data(:,2), 5, 'k', 'filled', 'DisplayName', 'Average Data Points'); title('Parabolic Function with Noisy Data Points'); xlabel('x'); ylabel('y'); legend('Location', 'North'); grid on; hold off; - Correct for my errors - Implement in MATLAB the algorithms for: Lagrange Interpolating Polynomial (LIP) - For polynomial curve fitting, examine 1st to 5th polynomial order then determine the right order to be used using the least value of AIC (Akaike Information Criterion) and BIC (Bayesian Information Criterion). Discuss the concepts and discuss the differences between AIC and BIC. - For the final evaluation of your curve fitting functions, use the Root Mean Square Error and Mean Absolute Error as the final metrics against Data 00. - Include plots/graphs.
close all;
clear all;
clc;
current_script = mfilename('fullpath');
script_directory = fileparts(current_script);
file_name0 = 'data_00.csv';
file_name1 = 'data_01.csv';
file_name2 = 'data_02.csv';
file_name3 = 'data_03.csv';
data0 = csvread([script_directory '\' file_name0]);
data1 = csvread([script_directory '\' file_name1]);
data2 = csvread([script_directory '\' file_name2]);
data3 = csvread([script_directory '\' file_name3]);
avg_data = (data1 + data2 + data3) / 3;
figure;
% plot (data0(:,1), data0(:,2), 'b-', 'LineWidth', 2, 'DisplayName', 'Parabolic Curve');
hold on;
% plot(avg_data(:, 1), avg_data(:, 2), 'k-', 'Linewidth', 1, 'DisplayName', 'Average Data Points');
plot(smooth_data(:, 1), smooth_data(:, 2), 'k-', 'Linewidth', 1, 'DisplayName', 'Smoothed Data');
scatter(data1(:,1), data1(:,2), 5, 'r', 'filled', 'DisplayName', 'Sample Data Points 1');
scatter(data2(:,1), data2(:,2), 5, 'g', 'filled', 'DisplayName', 'Sample Data Points 2');
scatter(data3(:,1), data3(:,2), 5, 'y', 'filled', 'DisplayName', 'Sample Data Points 3');
scatter(avg_data(:,1), avg_data(:,2), 5, 'k', 'filled', 'DisplayName', 'Average Data Points');
title('Parabolic Function with Noisy Data Points'); xlabel('x'); ylabel('y'); legend('Location', 'North');
grid on;
hold off;
- Correct for my errors
- Implement in MATLAB the
- For polynomial curve fitting, examine 1st to 5th polynomial order then determine the right order to be used using the least value of AIC (Akaike Information Criterion) and BIC (Bayesian Information Criterion). Discuss the concepts and discuss the differences between AIC and BIC.
- For the final evaluation of your curve fitting functions, use the Root Mean Square Error and Mean Absolute Error as the final metrics against Data 00.
- Include plots/graphs.
Step by step
Solved in 5 steps with 9 images

What if the data given gives a parabolic curve function? How to fix the linear line? Pls give me the correct code.


