Lab 3-Descriptive statistics This lab has 3 parts. All 3 parts must be submitted as one document. Part 1: Examining data This activity closely aligns with §2.8 from the OpenStax textbook 1. Randomly survey 30 classmates regarding the number of pairs of shoes they own. Record the values below. 2. Calculate the following values x = S= 3. Are the data discrete or continuous? How do you know?
Lab 3-Descriptive statistics This lab has 3 parts. All 3 parts must be submitted as one document. Part 1: Examining data This activity closely aligns with §2.8 from the OpenStax textbook 1. Randomly survey 30 classmates regarding the number of pairs of shoes they own. Record the values below. 2. Calculate the following values x = S= 3. Are the data discrete or continuous? How do you know?
Glencoe Algebra 1, Student Edition, 9780079039897, 0079039898, 2018
18th Edition
ISBN:9780079039897
Author:Carter
Publisher:Carter
Chapter10: Statistics
Section10.4: Distributions Of Data
Problem 23PFA
Related questions
Question

Transcribed Image Text:Lab 3 - Descriptive statistics
This lab has 3 parts. All 3 parts must be submitted as one document.
4.
Part 1: Examining data
This activity closely aligns with §2.8 from the OpenStax textbook
1.
values below.
Randomly survey 30 classmates regarding the number of pairs of shoes they own. Record the
2. Calculate the following values
X =
S =
3. Are the data discrete or continuous? How do you know?
Construct a histogram, with five or six intervals, using StatCrunch. Attach a print out to your work.
5.
Using complete sentences, describe the shape of the histogram you created in the previous
problem.
Expert Solution
This question has been solved!
Explore an expertly crafted, step-by-step solution for a thorough understanding of key concepts.
This is a popular solution!
Trending now
This is a popular solution!
Step by step
Solved in 4 steps

Follow-up Questions
Read through expert solutions to related follow-up questions below.
Follow-up Question

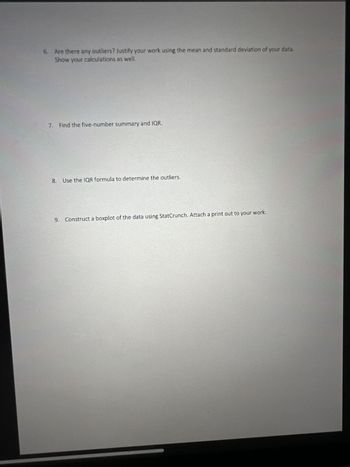
Transcribed Image Text:6. Are there any outliers? Justify your work using the mean and standard deviation of your data.
Show your calculations as well.
7. Find the five-number summary and IQR.
8.
Use the IQR formula to determine the outliers.
9. Construct a boxplot of the data using StatCrunch. Attach a print out to your work.
Solution
Recommended textbooks for you

Glencoe Algebra 1, Student Edition, 9780079039897…
Algebra
ISBN:
9780079039897
Author:
Carter
Publisher:
McGraw Hill

Big Ideas Math A Bridge To Success Algebra 1: Stu…
Algebra
ISBN:
9781680331141
Author:
HOUGHTON MIFFLIN HARCOURT
Publisher:
Houghton Mifflin Harcourt

Holt Mcdougal Larson Pre-algebra: Student Edition…
Algebra
ISBN:
9780547587776
Author:
HOLT MCDOUGAL
Publisher:
HOLT MCDOUGAL

Glencoe Algebra 1, Student Edition, 9780079039897…
Algebra
ISBN:
9780079039897
Author:
Carter
Publisher:
McGraw Hill

Big Ideas Math A Bridge To Success Algebra 1: Stu…
Algebra
ISBN:
9781680331141
Author:
HOUGHTON MIFFLIN HARCOURT
Publisher:
Houghton Mifflin Harcourt

Holt Mcdougal Larson Pre-algebra: Student Edition…
Algebra
ISBN:
9780547587776
Author:
HOLT MCDOUGAL
Publisher:
HOLT MCDOUGAL