In a comparison between the mean waiting time of the patients in the hospitals of Giza and Alexandria governments the minister of Health randomly selected 60 hospitals from Giza government and their mean waiting time was 30 minutes and the previous reports showed that the variance was 10 minutes. Also a sample consist of 50 hospitals from Alexandria governments was selected and their mean waiting time of this sample was 15 minutes and from previous reports the variance was 5 minutes. 1-Construct the 95% C.I for the difference between the average waiting time in Giza & Alex 2- Without any computations, discuss fully and precisely what will happen to the results you obtained in part (1) if the confidence level changed to be 99% instead of 95%. Give the reason for your answer


In a comparison between the mean waiting time of the patients in the hospitals of Giza and Alexandria governments the minister of Health randomly selected 60 hospitals from Giza government and their mean waiting time was 30 minutes and the previous reports showed that the variance was 10 minutes. Also a sample consist of 50 hospitals from Alexandria governments was selected and their mean waiting time of this sample was 15 minutes and from previous reports the variance was 5 minutes.
1-Construct the 95% C.I for the difference between the average waiting time in Giza & Alex
2- Without any computations, discuss fully and precisely what will happen to the results you obtained in part (1) if the confidence level changed to be 99% instead of 95%. Give the reason for your answer
1.
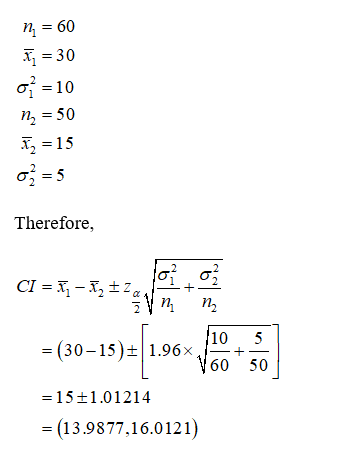
The 95% confidence interval for the difference between the average waiting time in Giza and Alex is constructed below:
From the given information, the value of α=0.05(=1 ̶ confidence level) .
From the standard normal table, the critical value corresponding with 0.05 and two tail test is 1.96.
Given that,

Step by step
Solved in 2 steps with 1 images


