Hedges' correction 2.67686 .416 -.294 1.1 Glass's delta 3.31442 .336 -.399 1.C e.- What is the p-value (hint: it is under “sig” in the output table)? The P-value is 0.44.

Glencoe Algebra 1, Student Edition, 9780079039897, 0079039898, 2018
18th Edition
ISBN:9780079039897
Author:Carter
Publisher:Carter
Chapter10: Statistics
Section10.4: Distributions Of Data
Problem 19PFA
icon
Related questions
Question

Check for accuracy and respond the last questions 

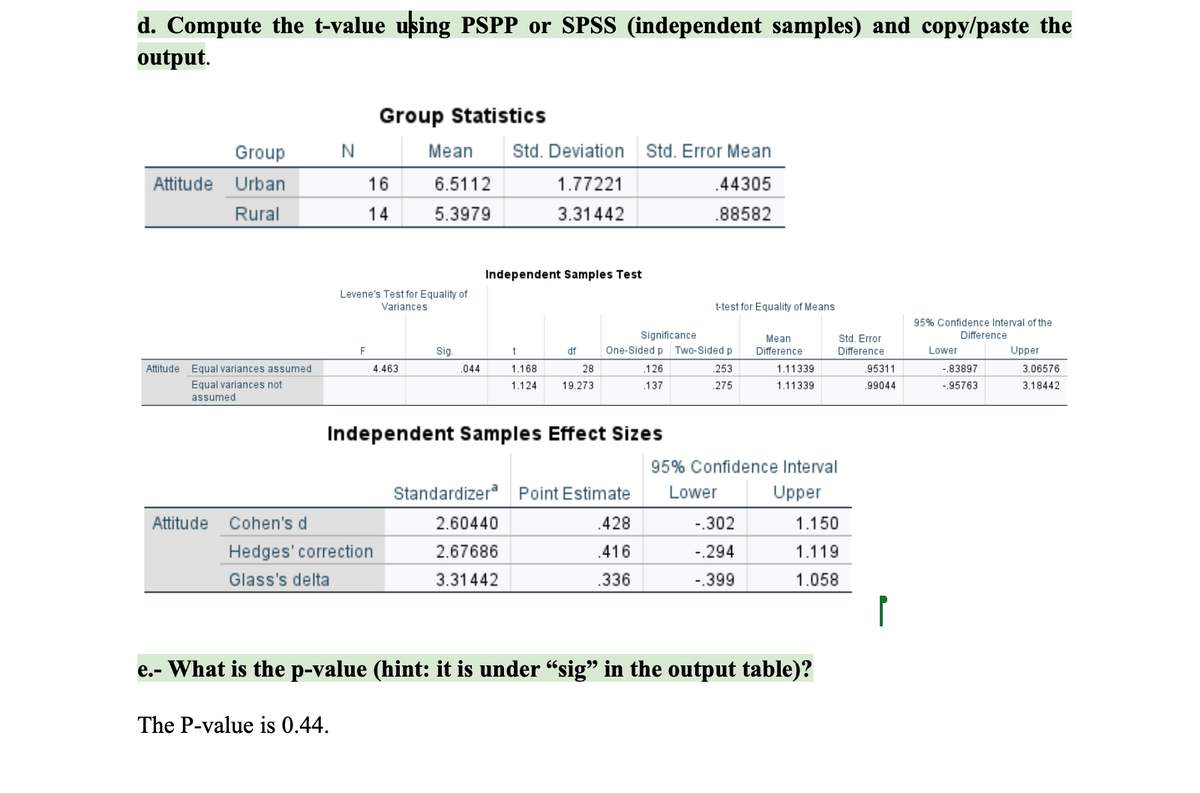
2. For this problem, use Chapter 11 Data Set 3. We want to know if urban and rural residents both have the same attitude toward gun control.

a. What is the null hypothesis?

The null hypothesis concludes that there is no difference in attitudes toward gun control between urban and rural residents.

b. What is the research hypothesis?

The research hypothesis suggests that there is a difference in attitudes toward gun control between urban and rural residents.

c. Will you be conducting a one-tailed or a two-tailed test? Why?

In this case I would conduct a two-tailed test because i’m interested in whether there is a difference in attitudes toward gun control between urban and rural residents, regardless of which direction that difference follows.


e.- What is the p-value (hint: it is under “sig” in the output table)? 

The P-value is 0.44.

  1. Do you reject the null hypothesis or fail to reject the null? What do you conclude about urban and rural residents’ attitudes toward gun control? 


g. What is the size of the effect? Is this a small, medium, or large effect? Show all of your work. (Use the formula on page 208 in Chapter 11 and the guidelines for interpreting effect sizes on page 196 in Chapter 10). Use the attached document. You can check your result by using the effect size calculator at https://lbecker.uccs.edu/. 


d. Compute the t-value using PSPP or SPSS (independent samples) and copy/paste the
output.
Group Statistics
Group
N
Mean
Attitude Urban
16
6.5112
Rural
14
5.3979
Std. Deviation Std. Error Mean
1.77221
3.31442
.44305
.88582
Independent Samples Test
Levene's Test for Equality of
Variances
t-test for Equality of Means
Significance
F
Sig.
t
df
One-Sided p Two-Sided p
Mean
Difference
Attitude
Equal variances assumed
Equal variances not
assumed
4.463
.044
1.168
1.124
28
19.273
.126
.253
.137
.275
1.11339
1.11339
Independent Samples Effect Sizes
95% Confidence Interval
Standardizera Point Estimate
Lower
Upper
Attitude Cohen's d
2.60440
.428
-.302
1.150
Hedges' correction
2.67686
.416
-.294
1.119
Glass's delta
3.31442
.336
-.399
1.058
e.- What is the p-value (hint: it is under “sig” in the output table)?
The P-value is 0.44.
Std. Error
Difference
95% Confidence Interval of the
Difference
Lower
Upper
.95311
-.83897
3.06576
99044
-.95763
3.18442
Transcribed Image Text:d. Compute the t-value using PSPP or SPSS (independent samples) and copy/paste the output. Group Statistics Group N Mean Attitude Urban 16 6.5112 Rural 14 5.3979 Std. Deviation Std. Error Mean 1.77221 3.31442 .44305 .88582 Independent Samples Test Levene's Test for Equality of Variances t-test for Equality of Means Significance F Sig. t df One-Sided p Two-Sided p Mean Difference Attitude Equal variances assumed Equal variances not assumed 4.463 .044 1.168 1.124 28 19.273 .126 .253 .137 .275 1.11339 1.11339 Independent Samples Effect Sizes 95% Confidence Interval Standardizera Point Estimate Lower Upper Attitude Cohen's d 2.60440 .428 -.302 1.150 Hedges' correction 2.67686 .416 -.294 1.119 Glass's delta 3.31442 .336 -.399 1.058 e.- What is the p-value (hint: it is under “sig” in the output table)? The P-value is 0.44. Std. Error Difference 95% Confidence Interval of the Difference Lower Upper .95311 -.83897 3.06576 99044 -.95763 3.18442
Expert Solution
trending now

Trending now

This is a popular solution!

steps

Step by step

Solved in 3 steps with 3 images

Blurred answer
Recommended textbooks for you
Glencoe Algebra 1, Student Edition, 9780079039897…
Algebra
ISBN:
9780079039897
Author:
Carter
Publisher:
McGraw Hill