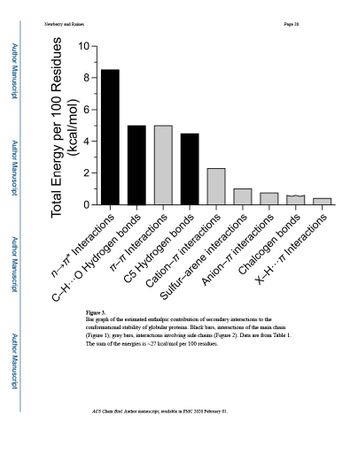
Refer to the bar graph below, Explain why the n→π* interactions contributes more to the overall stabilization of the protein than all the other interactions(C-H-O hydrogen bond,π-π interactions, C5 Hydrogen Bonds, Cation-π interactions, Sulfur-arene interactions, Anion-π interactions, Chalcogen bonds, X-H-π interactions) even though  n→π* is the weaker interaction. Explain why that's the case for EACH of the bonds.  I.e Why n→π* interactions contribute more to the overall stabilization of the protein than C-H-O hydrogen bonds, even though  n→π* is the weaker interaction. Why n→π* interactions contribute more to the overall stabilization of the protein than π-π interactions even though  n→π* is the weaker interaction. Why n→π* interactions contribute more to the overall stabilization of the protein than C5 Hydrogen Bonds, even though  n→π* is the weaker interaction.

Introduction to General, Organic and Biochemistry
11th Edition
ISBN:9781285869759
Author:Frederick A. Bettelheim, William H. Brown, Mary K. Campbell, Shawn O. Farrell, Omar Torres
Publisher:Frederick A. Bettelheim, William H. Brown, Mary K. Campbell, Shawn O. Farrell, Omar Torres
Chapter18: Carboxylic Acids
Section: Chapter Questions
Problem 18.54P
icon
Related questions
icon
Concept explainers
Question

Refer to the bar graph below, Explain why the n→π* interactions contributes more to the overall stabilization of the protein than all the other interactions(C-H-O hydrogen bond,π-π interactions, C5 Hydrogen Bonds, Cation-π interactions, Sulfur-arene interactions, Anion-π interactions, Chalcogen bonds, X-H-π interactions) even though  n→π* is the weaker interaction.

Explain why that's the case for EACH of the bonds. 

I.e

Why n→π* interactions contribute more to the overall stabilization of the protein than C-H-O hydrogen bonds, even though  n→π* is the weaker interaction.

Why n→π* interactions contribute more to the overall stabilization of the protein than π-π interactions even though  n→π* is the weaker interaction.

Why n→π* interactions contribute more to the overall stabilization of the protein than C5 Hydrogen Bonds, even though  n→π* is the weaker interaction.

Why n→π* interactions contribute more to the overall stabilization of the protein than Cation-π interactions, even though  n→π* is the weaker interaction.

Why n→π* interactions contribute more to the overall stabilization of the protein than Sulfur-arene interactions, even though  n→π* is the weaker interaction.

Why n→π* interactions contribute more to the overall stabilization of the protein than Anion-π interactions,  even though  n→π* is the weaker interaction.

Why n→π* interactions contribute more to the overall stabilization of the protein than Chalcogen bonds, even though  n→π* is the weaker interaction.

Why n→π* interactions contribute more to the overall stabilization of the protein than X-H-π interactions, even though  n→π* is the weaker interaction.

Author Manuscript
Author Manuscript
Author Manuscript
Author Manuscript
Newberry and Raines
မှာ
Total Energy per 100 Residues
(kcal/mol)
10
8
TT-TT Interactions
C5 Hydrogen bonds
n→* Interactions
C-HO Hydrogen bonds
Anion-77
Cation-77 interactions
Sulfur-arene interactions
Page 20
ACS Chem Biol Author manuscript, available in PMC 2020 February 01.
interactions
Chalcogen bonds
X-H77 Interactions
Figure 3.
Bar graph of the
estimated enthalpic contribution of secondary interactions the
conformational stability of globular proteins. Black bars, interactions of the main chain
(Figure 1); gray bars, interactions involving side chains (Figure 2). Data are from Table 1.
The sum of the energies is -27 kcal/mol per 100 residues.
Transcribed Image Text:Author Manuscript Author Manuscript Author Manuscript Author Manuscript Newberry and Raines မှာ Total Energy per 100 Residues (kcal/mol) 10 8 TT-TT Interactions C5 Hydrogen bonds n→* Interactions C-HO Hydrogen bonds Anion-77 Cation-77 interactions Sulfur-arene interactions Page 20 ACS Chem Biol Author manuscript, available in PMC 2020 February 01. interactions Chalcogen bonds X-H77 Interactions Figure 3. Bar graph of the estimated enthalpic contribution of secondary interactions the conformational stability of globular proteins. Black bars, interactions of the main chain (Figure 1); gray bars, interactions involving side chains (Figure 2). Data are from Table 1. The sum of the energies is -27 kcal/mol per 100 residues.
Expert Solution
steps

Step by step

Solved in 3 steps

Blurred answer
Follow-up Questions
Read through expert solutions to related follow-up questions below.
Follow-up Question

Refer to the bar graph below, Explain why the n→π* interactions contributes more to the overall stabilization of the protein than all the other interactions(C-H-O hydrogen bond,π-π interactions, C5 Hydrogen Bonds, Cation-π interactions, Sulfur-arene interactions, Anion-π interactions, Chalcogen bonds, X-H-π interactions) even though  n→π* is the weaker interaction.

Explain why that's the case for EACH of the bonds. 

Why n→π* interactions contribute more to the overall stabilization of the protein than Sulfur-arene interactions, even though  n→π* is the weaker interaction.

Why n→π* interactions contribute more to the overall stabilization of the protein than Anion-π interactions,  even though  n→π* is the weaker interaction.

Why n→π* interactions contribute more to the overall stabilization of the protein than Chalcogen bonds, even though  n→π* is the weaker interaction.

Why n→π* interactions contribute more to the overall stabilization of the protein than X-H-π interactions, even though  n→π* is the weaker interaction.
Author Manuscript
Author Manuscript
Author Manuscript
Author Manuscript
Newberry and Raines
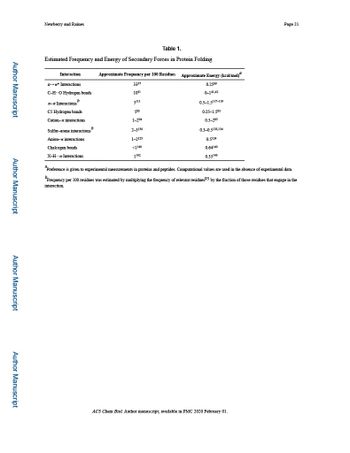
Table 1.
Estimated Frequency and Energy of Secondary Forces in Protein Folding
Interaction
* Interactions
C-H--O Hydrogen bonds
*-* Interactions
CS Hydrogen bonds
Cation- interactions
Sulfur-arene interactions
Anion- interactions
Chalcogen bonds
X-H- Interactions
Approximate Frequency per 100 Residues
3357
10³1
5111
583
1-2⁹4
2-3130
1-2125
1102
Approximate Energy (kcal/mol)
0.2569
0-141,42
0.5-1.5117-119
0.25-1.583
0.5-285
0.3-0.5133,134
0.5124
0.64140
0.35143
Page 21
*Preference is given to experimental measurements a proteins and peptides. Computational values are used in the absence of experimental data.
Frequency per 100 residues was estimated by multiplying the frequency of relevant residues95 by the fraction of those residues that engage in the
interaction.
ACS Chem Biol Author manuscript, available in PMC 2020 February 01.
Transcribed Image Text:Author Manuscript Author Manuscript Author Manuscript Author Manuscript Newberry and Raines Table 1. Estimated Frequency and Energy of Secondary Forces in Protein Folding Interaction * Interactions C-H--O Hydrogen bonds *-* Interactions CS Hydrogen bonds Cation- interactions Sulfur-arene interactions Anion- interactions Chalcogen bonds X-H- Interactions Approximate Frequency per 100 Residues 3357 10³1 5111 583 1-2⁹4 2-3130 1-2125 1102 Approximate Energy (kcal/mol) 0.2569 0-141,42 0.5-1.5117-119 0.25-1.583 0.5-285 0.3-0.5133,134 0.5124 0.64140 0.35143 Page 21 *Preference is given to experimental measurements a proteins and peptides. Computational values are used in the absence of experimental data. Frequency per 100 residues was estimated by multiplying the frequency of relevant residues95 by the fraction of those residues that engage in the interaction. ACS Chem Biol Author manuscript, available in PMC 2020 February 01.
Author Manuscript
Author Manuscript
Author Manuscript
Author Manuscript
Newberry and Raines
မှာ
Total Energy per 100 Residues
(kcal/mol)
10
8
TT-TT Interactions
C5 Hydrogen bonds
n→* Interactions
C-HO Hydrogen bonds
Anion-77
Cation-77 interactions
Sulfur-arene interactions
Page 20
ACS Chem Biol Author manuscript, available in PMC 2020 February 01.
interactions
Chalcogen bonds
X-H77 Interactions
Figure 3.
Bar graph of the
estimated enthalpic contribution of secondary interactions the
conformational stability of globular proteins. Black bars, interactions of the main chain
(Figure 1); gray bars, interactions involving side chains (Figure 2). Data are from Table 1.
The sum of the energies is -27 kcal/mol per 100 residues.
Transcribed Image Text:Author Manuscript Author Manuscript Author Manuscript Author Manuscript Newberry and Raines မှာ Total Energy per 100 Residues (kcal/mol) 10 8 TT-TT Interactions C5 Hydrogen bonds n→* Interactions C-HO Hydrogen bonds Anion-77 Cation-77 interactions Sulfur-arene interactions Page 20 ACS Chem Biol Author manuscript, available in PMC 2020 February 01. interactions Chalcogen bonds X-H77 Interactions Figure 3. Bar graph of the estimated enthalpic contribution of secondary interactions the conformational stability of globular proteins. Black bars, interactions of the main chain (Figure 1); gray bars, interactions involving side chains (Figure 2). Data are from Table 1. The sum of the energies is -27 kcal/mol per 100 residues.
Solution
Bartleby Expert
SEE SOLUTION
Knowledge Booster
Proteins
Learn more about
Need a deep-dive on the concept behind this application? Look no further. Learn more about this topic, chemistry and related others by exploring similar questions and additional content below.
Similar questions
  • SEE MORE QUESTIONS
Recommended textbooks for you
Introduction to General, Organic and Biochemistry
Chemistry
ISBN:
9781285869759
Author:
Frederick A. Bettelheim, William H. Brown, Mary K. Campbell, Shawn O. Farrell, Omar Torres
Publisher:
Cengage Learning
Organic Chemistry
Organic Chemistry
Chemistry
ISBN:
9781305080485
Author:
John E. McMurry
Publisher:
Cengage Learning
Organic Chemistry: A Guided Inquiry
Chemistry
ISBN:
9780618974122
Author:
Andrei Straumanis
Publisher:
Cengage Learning