Data are collected in a clinical trial evaluating a new compound designed to improve wound healing in trauma patients. The new compound is compared against a placebo. After treatment for 5 days with the new compound or placebo, the extent of wound healing is measured, and the data are shown below. Data for Practice Problem 1 and 2 Percent Wound healing Treatment 0-25% 26-50% 51-75% 76-100% New Compound (n=125) 15 37 32 41 Placebo (n=125) 36 43 34 10 Is there a difference in the extent of wound healing by treatment? (Hint: Are treatment and the percent wound healing independent?) Run the appropriate test at a 5% level of significance.


- Data are collected in a clinical trial evaluating a new compound designed to improve wound healing in trauma patients. The new compound is compared against a placebo. After treatment for 5 days with the new compound or placebo, the extent of wound healing is measured, and the data are shown below.
Data for Practice Problem 1 and 2
|
Percent Wound healing |
||||
|
Treatment |
0-25% |
26-50% |
51-75% |
76-100% |
|
New Compound (n=125) |
15 |
37 |
32 |
41 |
|
Placebo (n=125) |
36 |
43 |
34 |
10 |
Is there a difference in the extent of wound healing by treatment? (Hint: Are treatment and the percent wound healing independent?) Run the appropriate test at a 5% level of significance.
In this context, the aim is to test whether the treatment and the percent wound healing are independent.
Hypotheses:
H0 : The treatment and the percent wound healing are independent.
The alternative hypothesis is:
H1 : The treatment and the percent wound healing are not independent.
Calculation steps:
The calculations have been done in EXCEL.
Denote oij as the observed frequency for ith row and jth column (i =1, 2, 3, 4; j =1, 2) and eij as the expected frequency for ith row and jth column.
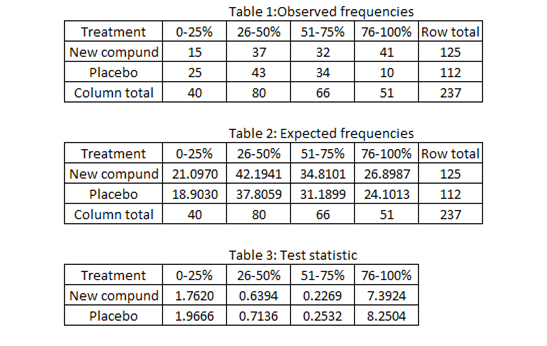
Table 1 provides the data values, oij.
Table 2 calculates the expected frequencies under the independence assumption. If independent, eij = (oi∙) ∙ (o∙j) / N. [o∙j = column total of jth column, N = grand total of all observations = 237]. So, the first cell expected frequency will be e11 = (40) ∙ 125) / 237= 21.0970. Similarly, the others can be calculated.
Table 3:Test statistic:
The formula for the test statistic is χ2 = ∑ [(oij – eij)2 / eij], summed over all i and j.
Table 4 calculates [(oij – eij)2 / eij] for each (i, j). So, the value in the first cell will be (15– 21.0970)2 / 21.0970 ≈ 1.7620.
The test statistic value can be calculated by adding all these cell values.
The degrees of freedom is (4 – 1) ∙ (2– 1) = 3.

Trending now
This is a popular solution!

Step by step
Solved in 2 steps with 1 images


