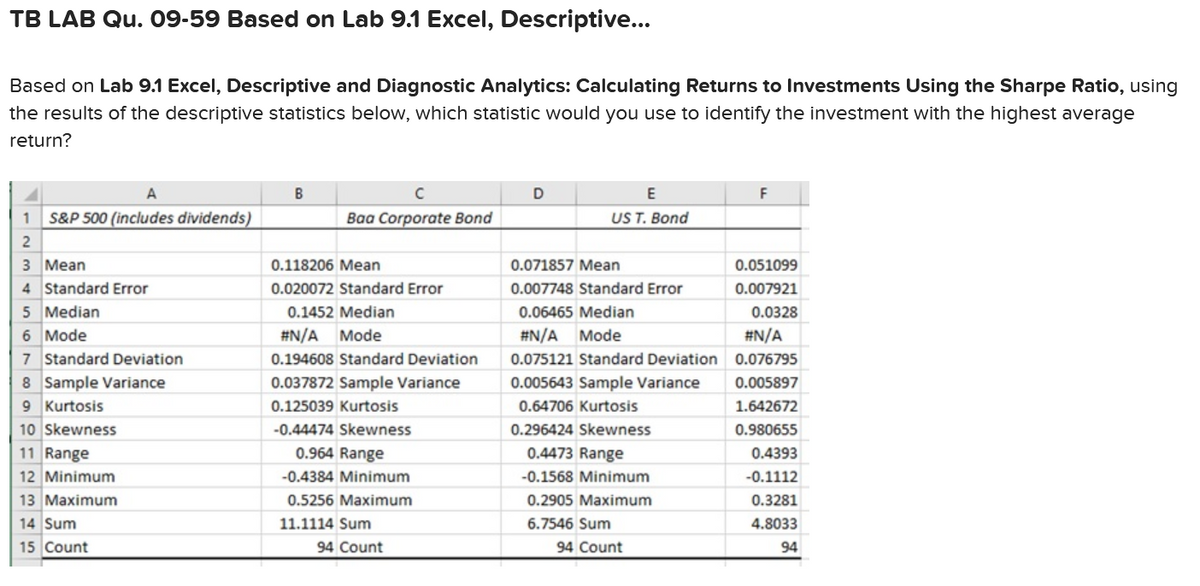
Based on Lab 9.1 Excel, Descriptive and Diagnostic Analytics: Calculating Returns to Investments Using the Sharpe Ratio, using the results of the descriptive statistics below, which statistic would you use to identify the investment with the highest average return? S&P 500 (includes dividends) 1 2 3 Mean 4 Standard Error 5 Median 6 Mode 7 Standard Deviation 8 Sample Variance 9 Kurtosis 10 Skewness 11 Range 12 Minimum 13 Maximum 14 Sum 15 Count B с Baa Corporate Bond 0.118206 Mean 0.020072 Standard Error 0.1452 Median #N/A Mode 0.194608 Standard Deviation 0.037872 Sample Variance 0.125039 Kurtosis -0.44474 Skewness 0.964 Range -0.4384 Minimum 0.5256 Maximum 11.1114 Sum 94 Count D E US T. Bond 0.071857 Mean 0.007748 Standard Error 0.06465 Median #N/A Mode 0.075121 Standard Deviation 0.005643 Sample Variance 0.64706 Kurtosis 0.296424 Skewness 0.4473 Range -0.1568 Minimum 0.2905 Maximum 6.7546 Sum 94 Count F 0.051099 0.007921 0.0328 #N/A 0.076795 0.005897 1.642672 0.980655 0.4393 -0.1112 0.3281 4.8033 94
Based on Lab 9.1 Excel, Descriptive and Diagnostic Analytics: Calculating Returns to Investments Using the Sharpe Ratio, using the results of the descriptive statistics below, which statistic would you use to identify the investment with the highest average return? S&P 500 (includes dividends) 1 2 3 Mean 4 Standard Error 5 Median 6 Mode 7 Standard Deviation 8 Sample Variance 9 Kurtosis 10 Skewness 11 Range 12 Minimum 13 Maximum 14 Sum 15 Count B с Baa Corporate Bond 0.118206 Mean 0.020072 Standard Error 0.1452 Median #N/A Mode 0.194608 Standard Deviation 0.037872 Sample Variance 0.125039 Kurtosis -0.44474 Skewness 0.964 Range -0.4384 Minimum 0.5256 Maximum 11.1114 Sum 94 Count D E US T. Bond 0.071857 Mean 0.007748 Standard Error 0.06465 Median #N/A Mode 0.075121 Standard Deviation 0.005643 Sample Variance 0.64706 Kurtosis 0.296424 Skewness 0.4473 Range -0.1568 Minimum 0.2905 Maximum 6.7546 Sum 94 Count F 0.051099 0.007921 0.0328 #N/A 0.076795 0.005897 1.642672 0.980655 0.4393 -0.1112 0.3281 4.8033 94
MATLAB: An Introduction with Applications
6th Edition
ISBN:9781119256830
Author:Amos Gilat
Publisher:Amos Gilat
Chapter1: Starting With Matlab
Section: Chapter Questions
Problem 1P
Related questions
Question

Transcribed Image Text:TB LAB Qu. 09-59 Based on Lab 9.1 Excel, Descriptive...
Based on Lab 9.1 Excel, Descriptive and Diagnostic Analytics: Calculating Returns to Investments Using the Sharpe Ratio, using
the results of the descriptive statistics below, which statistic would you use to identify the investment with the highest average
return?
A
1 S&P 500 (includes dividends)
2
3 Mean
4 Standard Error
5 Median
6 Mode
7 Standard Deviation
8 Sample Variance
9 Kurtosis
10 Skewness
11 Range
12 Minimum
13 Maximum
14 Sum
15 Count
B
с
Baa Corporate Bond
0.118206 Mean
0.020072 Standard Error
0.1452 Median
#N/A Mode
0.194608 Standard Deviation
0.037872 Sample Variance
0.125039 Kurtosis
-0.44474 Skewness
0.964 Range
-0.4384 Minimum
0.5256 Maximum
11.1114 Sum
94 Count
D
E
US T. Bond
0.071857 Mean
0.007748 Standard Error
0.06465 Median
#N/A Mode
0.075121 Standard Deviation
0.005643 Sample Variance
0.64706 Kurtosis
0.296424 Skewness
0.4473 Range
-0.1568 Minimum
0.2905 Maximum
6.7546 Sum
94 Count
F
0.051099
0.007921
0.0328
#N/A
0.076795
0.005897
1.642672
0.980655
0.4393
-0.1112
0.3281
4.8033
94
Expert Solution
This question has been solved!
Explore an expertly crafted, step-by-step solution for a thorough understanding of key concepts.
This is a popular solution!
Trending now
This is a popular solution!
Step by step
Solved in 3 steps with 6 images

Recommended textbooks for you

MATLAB: An Introduction with Applications
Statistics
ISBN:
9781119256830
Author:
Amos Gilat
Publisher:
John Wiley & Sons Inc

Probability and Statistics for Engineering and th…
Statistics
ISBN:
9781305251809
Author:
Jay L. Devore
Publisher:
Cengage Learning

Statistics for The Behavioral Sciences (MindTap C…
Statistics
ISBN:
9781305504912
Author:
Frederick J Gravetter, Larry B. Wallnau
Publisher:
Cengage Learning

MATLAB: An Introduction with Applications
Statistics
ISBN:
9781119256830
Author:
Amos Gilat
Publisher:
John Wiley & Sons Inc

Probability and Statistics for Engineering and th…
Statistics
ISBN:
9781305251809
Author:
Jay L. Devore
Publisher:
Cengage Learning

Statistics for The Behavioral Sciences (MindTap C…
Statistics
ISBN:
9781305504912
Author:
Frederick J Gravetter, Larry B. Wallnau
Publisher:
Cengage Learning

Elementary Statistics: Picturing the World (7th E…
Statistics
ISBN:
9780134683416
Author:
Ron Larson, Betsy Farber
Publisher:
PEARSON

The Basic Practice of Statistics
Statistics
ISBN:
9781319042578
Author:
David S. Moore, William I. Notz, Michael A. Fligner
Publisher:
W. H. Freeman

Introduction to the Practice of Statistics
Statistics
ISBN:
9781319013387
Author:
David S. Moore, George P. McCabe, Bruce A. Craig
Publisher:
W. H. Freeman