A data set includes 106 body temperatures of healthy adult humans having a mean of 98.7°F and a standard deviation of 0.66°F. Construct a 99% confidence interval estimate of the mean body temperature of all healthy humans. What does the sample suggest about the use of 98.6°F as the mean body temperature? Click here to view a t distribution table. Click here to view page 1 of the standard normal distribution table. Click here to view page 2 of the standard normal distribution table. What is the confidence interval estimate of the population mean µ? °F
A data set includes 106 body temperatures of healthy adult humans having a mean of 98.7°F and a standard deviation of 0.66°F. Construct a 99% confidence interval estimate of the mean body temperature of all healthy humans. What does the sample suggest about the use of 98.6°F as the mean body temperature? Click here to view a t distribution table. Click here to view page 1 of the standard normal distribution table. Click here to view page 2 of the standard normal distribution table. What is the confidence interval estimate of the population mean µ? °F

Algebra & Trigonometry with Analytic Geometry
13th Edition
ISBN:9781133382119
Author:Swokowski
Publisher:Swokowski
Chapter4: Polynomial And Rational Functions
Section4.6: Variation
Problem 31E

Related questions
Question
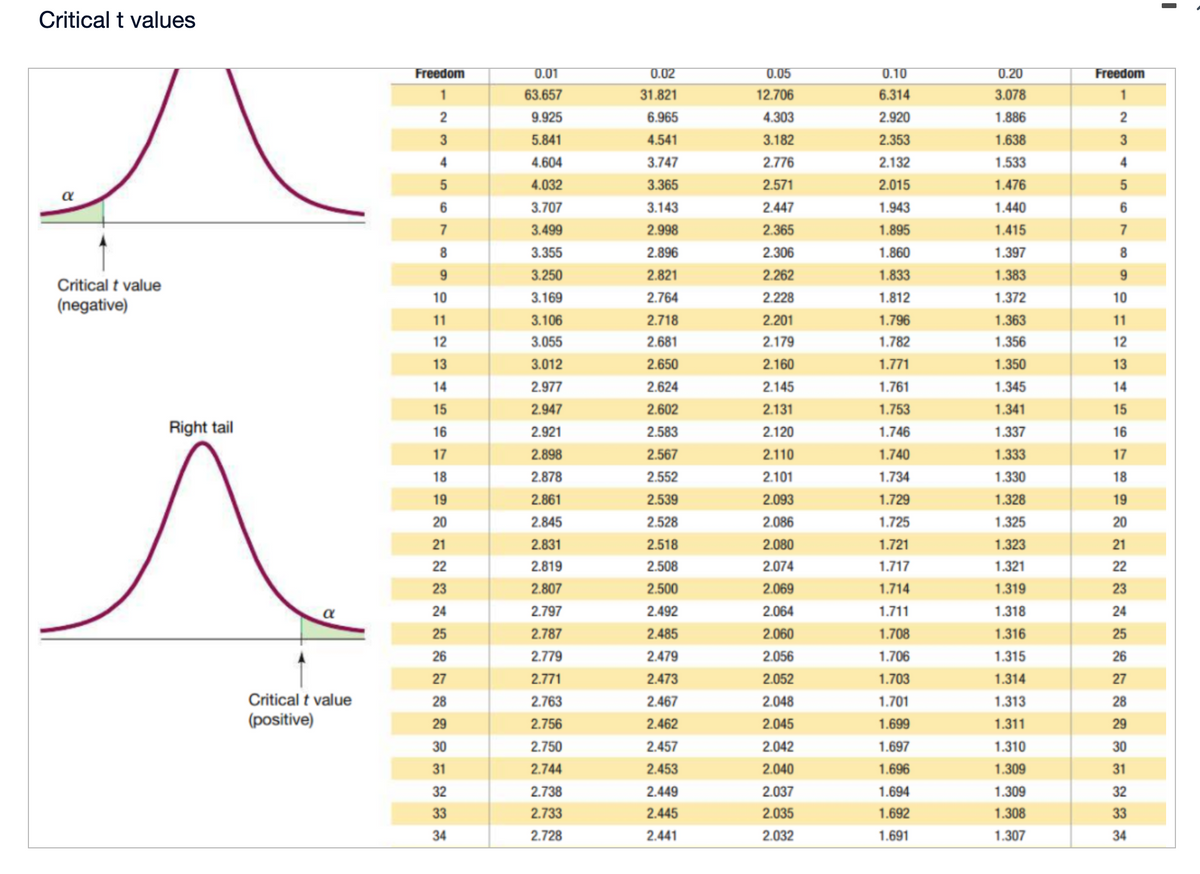
Transcribed Image Text:Critical t values
α
Critical t value
(negative)
Right tail
α
Critical t value
(positive)
Freedom
1
2
3
4
5
6
7
8
9
10
11
12
13
14
15
16
17
18
19
20
21
22
23
24
25
26
27
28
29
30
31
32
33
34
0.01
63.657
9.925
5.841
4.604
4.032
3.707
3.499
3.355
3.250
3.169
3.106
3.055
3.012
2.977
2.947
2.921
2.898
2.878
2.861
2.845
2.831
2.819
2.807
2.797
2.787
2.779
2.771
2.763
2.756
2.750
2.744
2.738
2.733
2.728
0.02
31.821
6.965
4.541
3.747
3.365
3.143
2.998
2.
2.821
2.764
2.718
2.681
2.650
2.624
2.602
2.583
2.567
2.552
2.539
2.528
2.518
2.508
2.500
2.492
2.485
2.479
2.473
2.467
2.462
2.457
2.453
2.449
2.445
2.441
0.05
12.706
4.303
3.182
2.776
2.571
2.447
2.365
2.306
2.262
2.228
2.201
2.179
2.160
2.145
2.131
2.120
2.110
2.101
2.093
2.086
2.080
2.074
2.069
2.064
2.060
2.056
2.052
2.048
2.045
2.042
2.040
2.037
2.035
2.032
0.10
6.314
2.920
2.353
2.132
2.015
1.943
1.895
1.860
1.833
1.812
1.796
1.782
1.771
1.761
1.753
1.746
1.740
1.734
1.729
1.725
1.721
1.717
1.714
1.711
1.708
1.706
1.703
1.701
1.699
1.697
1.696
1.694
1.692
1.691
0.20
3.078
1.886
1.638
1.533
1.476
1.440
1.415
1.397
1.383
1.372
1.363
1.356
1.350
1.345
1.341
1.337
1.333
1.330
1.328
1.325
1.323
1.321
1.319
1.318
1.316
1.315
1.314
1.313
1.311
1.310
1.309
1.309
1.308
1.307
Freedom
1
2
3
4
5
6
7
8
9
10
11
12
13
14
15
16
17
18
19
20
21
22
23
24
25
26
27
28
29
30
31
32
33
34
I
Transcribed Image Text:A data set includes 106 body temperatures of healthy adult humans having a mean of 98.7 °F and a standard deviation of 0.66°F. Construct a 99% confidence interval estimate of the mean body temperature of all healthy humans. What does the
sample suggest about the use of 98.6°F as the mean body temperature?
Click here to view a t distribution table.
Click here to view page 1 of the standard normal distribution table.
Click here to view page 2 of the standard normal distribution table.
What is the confidence interval estimate of the population mean μ?
°F<μ< °F
(Round to three decimal places as needed.)
What does this suggest about the use of 98.6°F as the mean body temperature?
A. This suggests that the mean body temperature is higher than 98.6°F.
B. This suggests that the mean body temperature is lower than 98.6°F.
C. This suggests that the mean body temperature could very possibly be 98.6°F.
Expert Solution
This question has been solved!
Explore an expertly crafted, step-by-step solution for a thorough understanding of key concepts.

This is a popular solution!

Trending now
This is a popular solution!

Step by step
Solved in 4 steps with 11 images

Recommended textbooks for you
Algebra & Trigonometry with Analytic Geometry
Algebra
ISBN:
9781133382119
Author:
Swokowski
Publisher:
Cengage

Functions and Change: A Modeling Approach to Coll…
Algebra
ISBN:
9781337111348
Author:
Bruce Crauder, Benny Evans, Alan Noell
Publisher:
Cengage Learning
Algebra & Trigonometry with Analytic Geometry
Algebra
ISBN:
9781133382119
Author:
Swokowski
Publisher:
Cengage
Functions and Change: A Modeling Approach to Coll…
Algebra
ISBN:
9781337111348
Author:
Bruce Crauder, Benny Evans, Alan Noell
Publisher:
Cengage Learning