Test the claim about the population mean, µ, at the given level of significance using the given sample statistic Claim: μ#6000; α=0.07; o=389. Sample statistics: x=6200, n = 35 Identify the null and alternative hypotheses. Choose the correct answer below. OA. Ho μ-6000 Ha: μ#6000 OC. Ho μ#6000 H₂ μ = 6000 *** E. Ho: ²6000 H₂ μ#6000 O B. Ho μ≤6000 Ha μ#6000 O D. Ho μ#6000 Hg: με 6000 OF. Ho #6000 H₂ μ≤6000
Test the claim about the population mean, µ, at the given level of significance using the given sample statistic Claim: μ#6000; α=0.07; o=389. Sample statistics: x=6200, n = 35 Identify the null and alternative hypotheses. Choose the correct answer below. OA. Ho μ-6000 Ha: μ#6000 OC. Ho μ#6000 H₂ μ = 6000 *** E. Ho: ²6000 H₂ μ#6000 O B. Ho μ≤6000 Ha μ#6000 O D. Ho μ#6000 Hg: με 6000 OF. Ho #6000 H₂ μ≤6000
Glencoe Algebra 1, Student Edition, 9780079039897, 0079039898, 2018
18th Edition
ISBN:9780079039897
Author:Carter
Publisher:Carter
Chapter10: Statistics
Section10.5: Comparing Sets Of Data
Problem 14PPS
Related questions
Question

Transcribed Image Text:Test the claim about the population mean, u, at the given level of significance using the given sample statistics.
Claim: #6000; α=0.07; = 389. Sample statistics: x=6200, n=35
μ
Identify the null and alternative hypotheses. Choose the correct answer below.
Ο A. Ho: μ = 6000
Ha: µ#6000
OC. Ho µ‡ 6000
H₂ μ=6000
QE. Ho: 26000
H₂: μ#6000
OB. Ho u≤6000
Ha μ#6000
O D. Ho: μ#6000
Hai μ ≥6000
OF. Ho μ#6000
H₂ μ≤6000
11
Expert Solution
This question has been solved!
Explore an expertly crafted, step-by-step solution for a thorough understanding of key concepts.
Step by step
Solved in 3 steps with 1 images

Follow-up Questions
Read through expert solutions to related follow-up questions below.
Follow-up Question

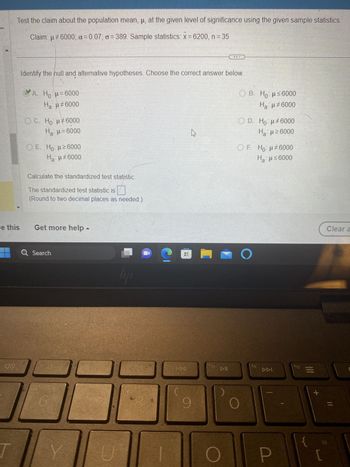
Transcribed Image Text:Test the claim about the population mean, µ, at the given level of significance using the given sample statistics.
Claim: μ#6000; a= 0.07; a=389. Sample statistics: x = 6200, n = 35
e this
70
Identify the hull and alternative hypotheses. Choose the correct answer below.
A. H=6000
Ha: µ‡6000
OC. Ho: μ‡6000
H₂:µ=6000
O E. Ho: µ ≥6000
Ha:µ‡6000
Calculate the standardized test statistic.
The standardized test statistic is
(Round to two decimal places as needed.)
Get more help -
Q Search
6
lipi
DC
U
98
J
ESDEN
tg
pag
8
বিব
DE
9
M
f10
DII
ⒸB. Ho: μ≤6000
Ha: μ‡6000
OD. Ho: μ#6000
Ha: μ ≥6000
OF. Ho: μ#6000
Ha: μ≤6000
O
f11
DDI
P
f12
1!1
+
Clear a
=
Solution
Recommended textbooks for you

Glencoe Algebra 1, Student Edition, 9780079039897…
Algebra
ISBN:
9780079039897
Author:
Carter
Publisher:
McGraw Hill

Glencoe Algebra 1, Student Edition, 9780079039897…
Algebra
ISBN:
9780079039897
Author:
Carter
Publisher:
McGraw Hill